U.S. Virgin Islander vs Immigrants from Mexico Unemployment Among Youth under 25 years
COMPARE
U.S. Virgin Islander
Immigrants from Mexico
Unemployment Among Youth under 25 years
Unemployment Among Youth under 25 years Comparison
U.S. Virgin Islanders
Immigrants from Mexico
13.6%
UNEMPLOYMENT AMONG YOUTH UNDER 25 YEARS
0.0/ 100
METRIC RATING
297th/ 347
METRIC RANK
12.4%
UNEMPLOYMENT AMONG YOUTH UNDER 25 YEARS
0.1/ 100
METRIC RATING
262nd/ 347
METRIC RANK
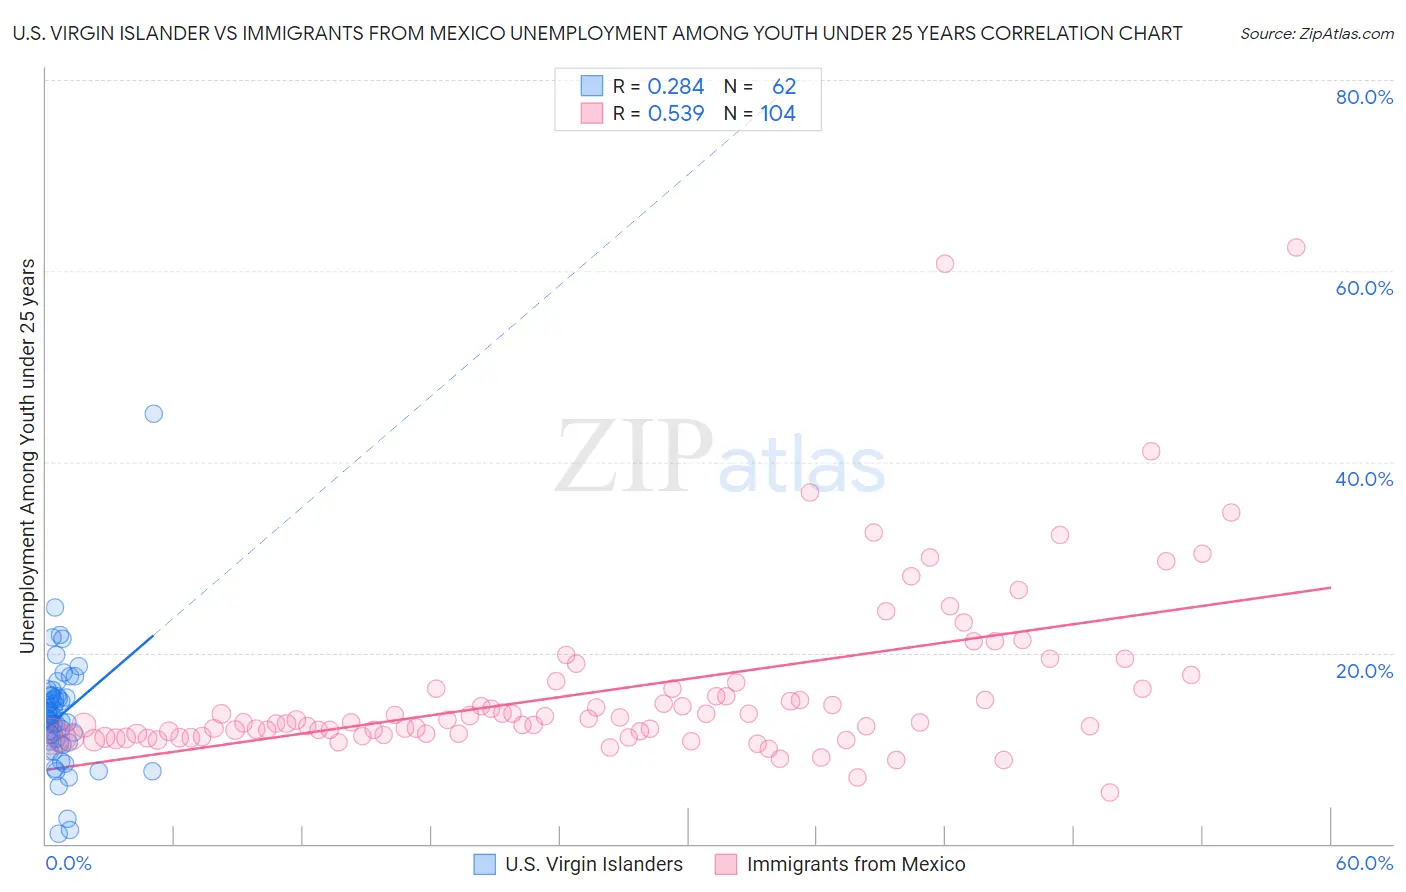
U.S. Virgin Islander vs Immigrants from Mexico Unemployment Among Youth under 25 years Correlation Chart
The statistical analysis conducted on geographies consisting of 87,396,014 people shows a weak positive correlation between the proportion of U.S. Virgin Islanders and unemployment rate among youth under the age of 25 in the United States with a correlation coefficient (R) of 0.284 and weighted average of 13.6%. Similarly, the statistical analysis conducted on geographies consisting of 500,400,910 people shows a substantial positive correlation between the proportion of Immigrants from Mexico and unemployment rate among youth under the age of 25 in the United States with a correlation coefficient (R) of 0.539 and weighted average of 12.4%, a difference of 9.5%.
Unemployment Among Youth under 25 years Correlation Summary
| Measurement | U.S. Virgin Islander | Immigrants from Mexico |
| Minimum | 1.1% | 5.4% |
| Maximum | 45.1% | 62.5% |
| Range | 44.0% | 57.1% |
| Mean | 13.5% | 16.1% |
| Median | 13.0% | 12.7% |
| Interquartile 25% (IQ1) | 10.6% | 11.4% |
| Interquartile 75% (IQ3) | 15.4% | 16.3% |
| Interquartile Range (IQR) | 4.8% | 4.9% |
| Standard Deviation (Sample) | 6.1% | 9.2% |
| Standard Deviation (Population) | 6.1% | 9.2% |
Similar Demographics by Unemployment Among Youth under 25 years
Demographics Similar to U.S. Virgin Islanders by Unemployment Among Youth under 25 years
In terms of unemployment among youth under 25 years, the demographic groups most similar to U.S. Virgin Islanders are Senegalese (13.5%, a difference of 0.62%), Chippewa (13.5%, a difference of 0.65%), Shoshone (13.7%, a difference of 0.86%), Immigrants from Caribbean (13.5%, a difference of 0.88%), and Spanish American Indian (13.5%, a difference of 1.1%).
| Demographics | Rating | Rank | Unemployment Among Youth under 25 years |
| Immigrants | Ecuador | 0.0 /100 | #290 | Tragic 13.4% |
| Apache | 0.0 /100 | #291 | Tragic 13.5% |
| Central American Indians | 0.0 /100 | #292 | Tragic 13.5% |
| Spanish American Indians | 0.0 /100 | #293 | Tragic 13.5% |
| Immigrants | Caribbean | 0.0 /100 | #294 | Tragic 13.5% |
| Chippewa | 0.0 /100 | #295 | Tragic 13.5% |
| Senegalese | 0.0 /100 | #296 | Tragic 13.5% |
| U.S. Virgin Islanders | 0.0 /100 | #297 | Tragic 13.6% |
| Shoshone | 0.0 /100 | #298 | Tragic 13.7% |
| Tohono O'odham | 0.0 /100 | #299 | Tragic 13.8% |
| Immigrants | Cabo Verde | 0.0 /100 | #300 | Tragic 13.8% |
| Immigrants | Senegal | 0.0 /100 | #301 | Tragic 13.8% |
| Immigrants | Sierra Leone | 0.0 /100 | #302 | Tragic 13.8% |
| Belizeans | 0.0 /100 | #303 | Tragic 13.8% |
| Houma | 0.0 /100 | #304 | Tragic 13.8% |
Demographics Similar to Immigrants from Mexico by Unemployment Among Youth under 25 years
In terms of unemployment among youth under 25 years, the demographic groups most similar to Immigrants from Mexico are Immigrants from El Salvador (12.4%, a difference of 0.050%), Immigrants from Panama (12.4%, a difference of 0.060%), Cree (12.4%, a difference of 0.090%), Immigrants from Central America (12.4%, a difference of 0.36%), and Salvadoran (12.4%, a difference of 0.42%).
| Demographics | Rating | Rank | Unemployment Among Youth under 25 years |
| Hispanics or Latinos | 0.2 /100 | #255 | Tragic 12.4% |
| Liberians | 0.2 /100 | #256 | Tragic 12.4% |
| Panamanians | 0.2 /100 | #257 | Tragic 12.4% |
| Salvadorans | 0.1 /100 | #258 | Tragic 12.4% |
| Immigrants | Central America | 0.1 /100 | #259 | Tragic 12.4% |
| Immigrants | Panama | 0.1 /100 | #260 | Tragic 12.4% |
| Immigrants | El Salvador | 0.1 /100 | #261 | Tragic 12.4% |
| Immigrants | Mexico | 0.1 /100 | #262 | Tragic 12.4% |
| Cree | 0.1 /100 | #263 | Tragic 12.4% |
| Puget Sound Salish | 0.1 /100 | #264 | Tragic 12.5% |
| Nepalese | 0.0 /100 | #265 | Tragic 12.5% |
| Immigrants | Latin America | 0.0 /100 | #266 | Tragic 12.6% |
| Sub-Saharan Africans | 0.0 /100 | #267 | Tragic 12.6% |
| Tlingit-Haida | 0.0 /100 | #268 | Tragic 12.7% |
| Kiowa | 0.0 /100 | #269 | Tragic 12.7% |