U.S. Virgin Islander vs Immigrants from West Indies Unemployment Among Women with Children Under 6 years
COMPARE
U.S. Virgin Islander
Immigrants from West Indies
Unemployment Among Women with Children Under 6 years
Unemployment Among Women with Children Under 6 years Comparison
U.S. Virgin Islanders
Immigrants from West Indies
8.7%
UNEMPLOYMENT AMONG WOMEN WITH CHILDREN UNDER 6 YEARS
0.0/ 100
METRIC RATING
285th/ 347
METRIC RANK
9.0%
UNEMPLOYMENT AMONG WOMEN WITH CHILDREN UNDER 6 YEARS
0.0/ 100
METRIC RATING
303rd/ 347
METRIC RANK
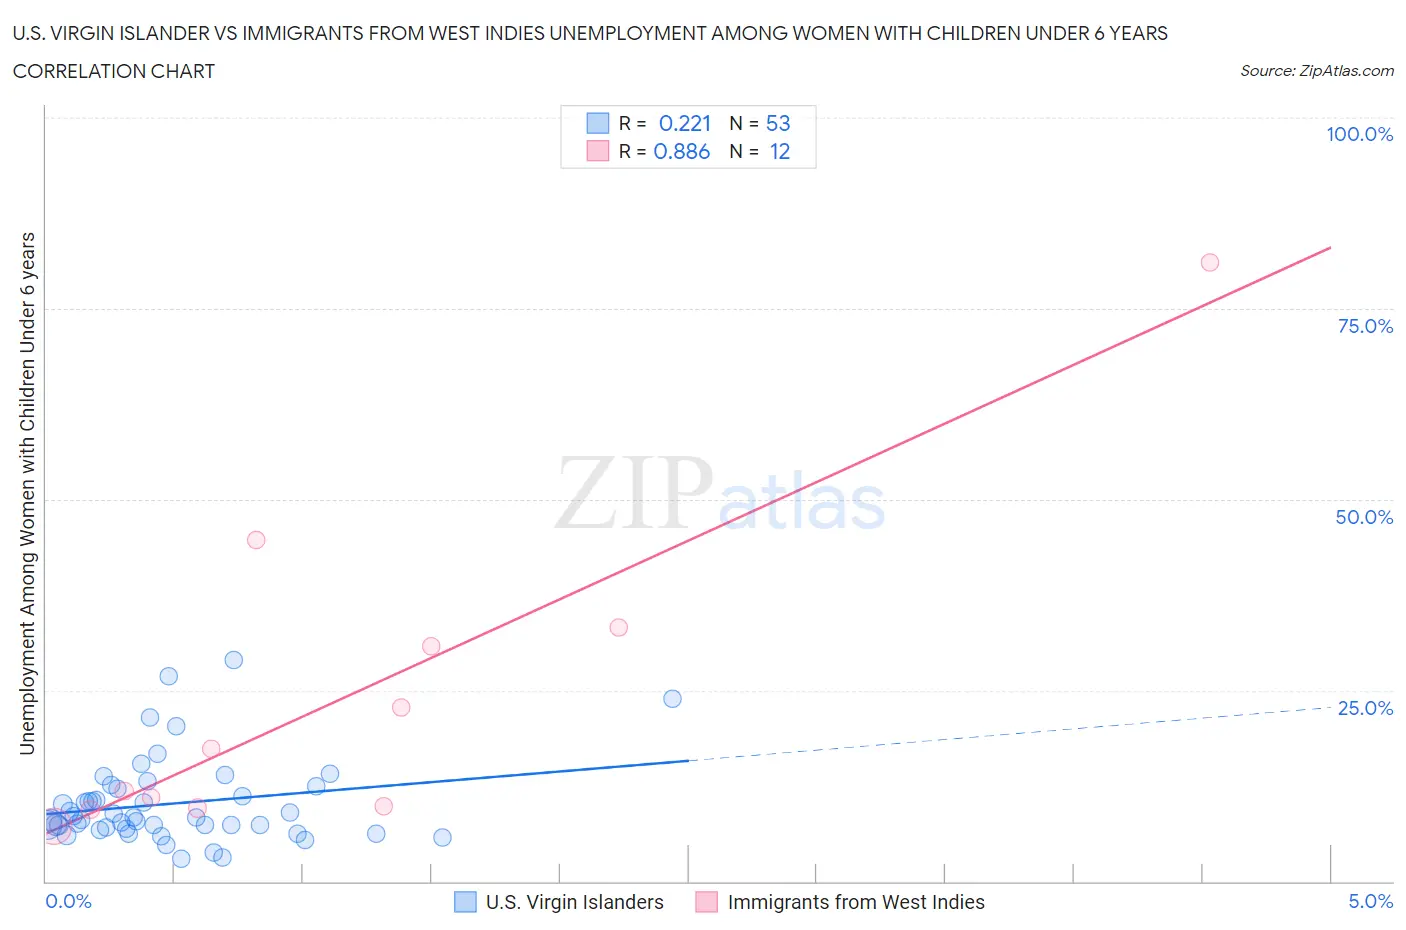
U.S. Virgin Islander vs Immigrants from West Indies Unemployment Among Women with Children Under 6 years Correlation Chart
The statistical analysis conducted on geographies consisting of 81,534,481 people shows a weak positive correlation between the proportion of U.S. Virgin Islanders and unemployment rate among women with children under the age of 6 in the United States with a correlation coefficient (R) of 0.221 and weighted average of 8.7%. Similarly, the statistical analysis conducted on geographies consisting of 68,002,118 people shows a very strong positive correlation between the proportion of Immigrants from West Indies and unemployment rate among women with children under the age of 6 in the United States with a correlation coefficient (R) of 0.886 and weighted average of 9.0%, a difference of 4.0%.
Unemployment Among Women with Children Under 6 years Correlation Summary
| Measurement | U.S. Virgin Islander | Immigrants from West Indies |
| Minimum | 2.9% | 7.2% |
| Maximum | 29.0% | 81.0% |
| Range | 26.1% | 73.8% |
| Mean | 10.2% | 24.0% |
| Median | 8.3% | 14.6% |
| Interquartile 25% (IQ1) | 6.9% | 9.7% |
| Interquartile 75% (IQ3) | 12.3% | 32.0% |
| Interquartile Range (IQR) | 5.4% | 22.3% |
| Standard Deviation (Sample) | 5.6% | 21.5% |
| Standard Deviation (Population) | 5.5% | 20.6% |
Demographics Similar to U.S. Virgin Islanders and Immigrants from West Indies by Unemployment Among Women with Children Under 6 years
In terms of unemployment among women with children under 6 years, the demographic groups most similar to U.S. Virgin Islanders are Seminole (8.7%, a difference of 0.0%), Menominee (8.7%, a difference of 0.15%), Blackfeet (8.7%, a difference of 0.20%), Bahamian (8.7%, a difference of 0.35%), and Iroquois (8.7%, a difference of 0.46%). Similarly, the demographic groups most similar to Immigrants from West Indies are Hispanic or Latino (9.0%, a difference of 0.030%), Immigrants from Mexico (9.1%, a difference of 0.14%), Chickasaw (9.0%, a difference of 0.91%), Creek (8.9%, a difference of 1.5%), and Immigrants from Jamaica (8.9%, a difference of 1.5%).
| Demographics | Rating | Rank | Unemployment Among Women with Children Under 6 years |
| Blackfeet | 0.0 /100 | #284 | Tragic 8.7% |
| U.S. Virgin Islanders | 0.0 /100 | #285 | Tragic 8.7% |
| Seminole | 0.0 /100 | #286 | Tragic 8.7% |
| Menominee | 0.0 /100 | #287 | Tragic 8.7% |
| Bahamians | 0.0 /100 | #288 | Tragic 8.7% |
| Iroquois | 0.0 /100 | #289 | Tragic 8.7% |
| Vietnamese | 0.0 /100 | #290 | Tragic 8.8% |
| Jamaicans | 0.0 /100 | #291 | Tragic 8.8% |
| Cheyenne | 0.0 /100 | #292 | Tragic 8.8% |
| Immigrants | Bangladesh | 0.0 /100 | #293 | Tragic 8.8% |
| Immigrants | Nonimmigrants | 0.0 /100 | #294 | Tragic 8.8% |
| Immigrants | Central America | 0.0 /100 | #295 | Tragic 8.9% |
| Immigrants | Dominican Republic | 0.0 /100 | #296 | Tragic 8.9% |
| Mexicans | 0.0 /100 | #297 | Tragic 8.9% |
| Tlingit-Haida | 0.0 /100 | #298 | Tragic 8.9% |
| Immigrants | Jamaica | 0.0 /100 | #299 | Tragic 8.9% |
| Creek | 0.0 /100 | #300 | Tragic 8.9% |
| Chickasaw | 0.0 /100 | #301 | Tragic 9.0% |
| Hispanics or Latinos | 0.0 /100 | #302 | Tragic 9.0% |
| Immigrants | West Indies | 0.0 /100 | #303 | Tragic 9.0% |
| Immigrants | Mexico | 0.0 /100 | #304 | Tragic 9.1% |