U.S. Virgin Islander vs Fijian Unemployment Among Women with Children Under 6 years
COMPARE
U.S. Virgin Islander
Fijian
Unemployment Among Women with Children Under 6 years
Unemployment Among Women with Children Under 6 years Comparison
U.S. Virgin Islanders
Fijians
8.7%
UNEMPLOYMENT AMONG WOMEN WITH CHILDREN UNDER 6 YEARS
0.0/ 100
METRIC RATING
285th/ 347
METRIC RANK
9.3%
UNEMPLOYMENT AMONG WOMEN WITH CHILDREN UNDER 6 YEARS
0.0/ 100
METRIC RATING
314th/ 347
METRIC RANK
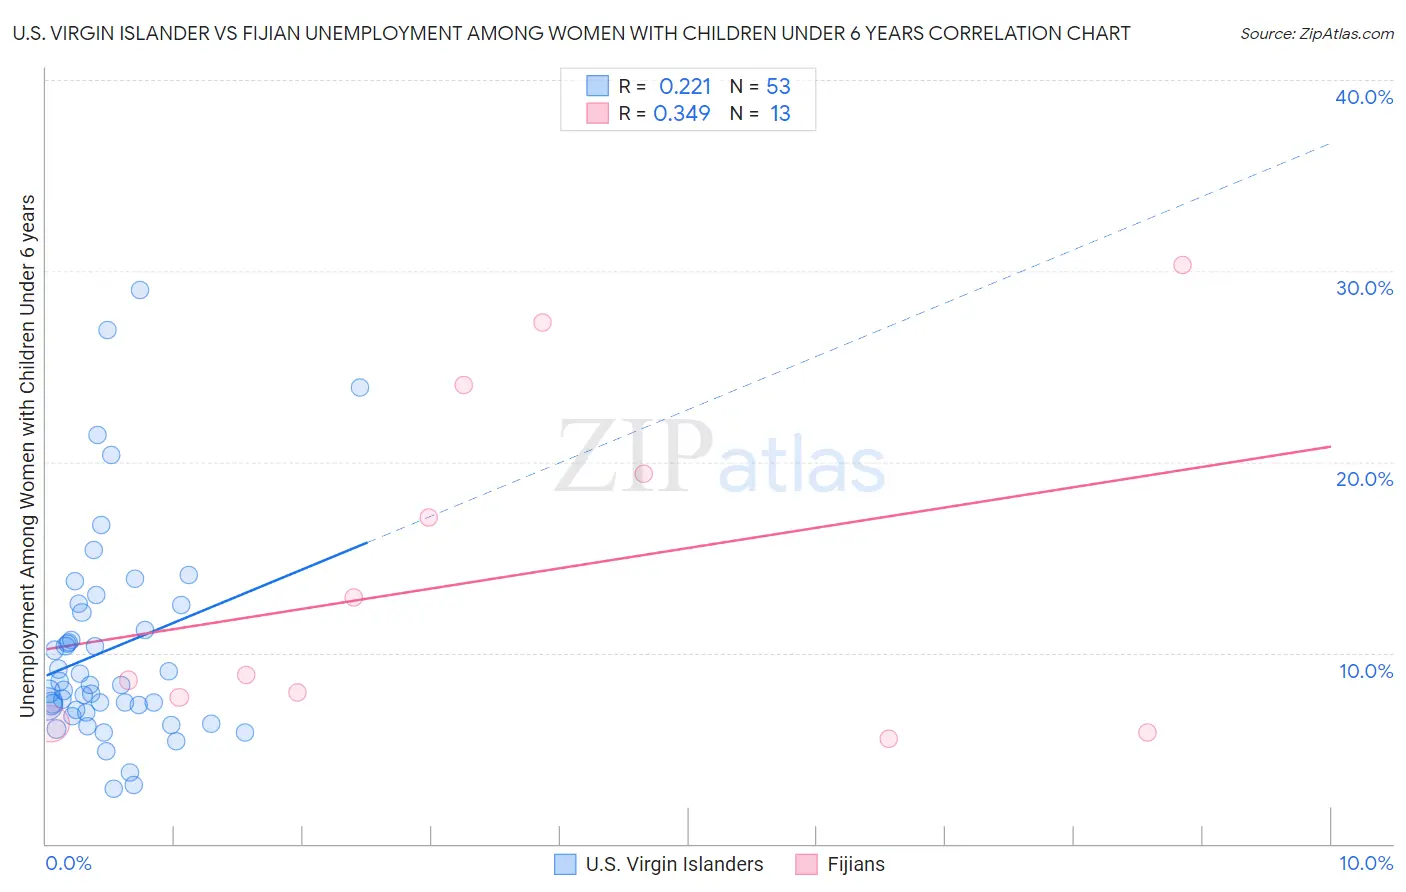
U.S. Virgin Islander vs Fijian Unemployment Among Women with Children Under 6 years Correlation Chart
The statistical analysis conducted on geographies consisting of 81,534,481 people shows a weak positive correlation between the proportion of U.S. Virgin Islanders and unemployment rate among women with children under the age of 6 in the United States with a correlation coefficient (R) of 0.221 and weighted average of 8.7%. Similarly, the statistical analysis conducted on geographies consisting of 52,101,365 people shows a mild positive correlation between the proportion of Fijians and unemployment rate among women with children under the age of 6 in the United States with a correlation coefficient (R) of 0.349 and weighted average of 9.3%, a difference of 6.4%.
Unemployment Among Women with Children Under 6 years Correlation Summary
| Measurement | U.S. Virgin Islander | Fijian |
| Minimum | 2.9% | 5.5% |
| Maximum | 29.0% | 30.3% |
| Range | 26.1% | 24.8% |
| Mean | 10.2% | 14.0% |
| Median | 8.3% | 8.8% |
| Interquartile 25% (IQ1) | 6.9% | 7.0% |
| Interquartile 75% (IQ3) | 12.3% | 21.7% |
| Interquartile Range (IQR) | 5.4% | 14.7% |
| Standard Deviation (Sample) | 5.6% | 8.7% |
| Standard Deviation (Population) | 5.5% | 8.4% |
Similar Demographics by Unemployment Among Women with Children Under 6 years
Demographics Similar to U.S. Virgin Islanders by Unemployment Among Women with Children Under 6 years
In terms of unemployment among women with children under 6 years, the demographic groups most similar to U.S. Virgin Islanders are Seminole (8.7%, a difference of 0.0%), Menominee (8.7%, a difference of 0.15%), Blackfeet (8.7%, a difference of 0.20%), Bahamian (8.7%, a difference of 0.35%), and Spanish American Indian (8.7%, a difference of 0.36%).
| Demographics | Rating | Rank | Unemployment Among Women with Children Under 6 years |
| Immigrants | Dominica | 0.0 /100 | #278 | Tragic 8.6% |
| Immigrants | Guatemala | 0.0 /100 | #279 | Tragic 8.6% |
| Immigrants | Belize | 0.0 /100 | #280 | Tragic 8.6% |
| Guatemalans | 0.0 /100 | #281 | Tragic 8.7% |
| Bermudans | 0.0 /100 | #282 | Tragic 8.7% |
| Spanish American Indians | 0.0 /100 | #283 | Tragic 8.7% |
| Blackfeet | 0.0 /100 | #284 | Tragic 8.7% |
| U.S. Virgin Islanders | 0.0 /100 | #285 | Tragic 8.7% |
| Seminole | 0.0 /100 | #286 | Tragic 8.7% |
| Menominee | 0.0 /100 | #287 | Tragic 8.7% |
| Bahamians | 0.0 /100 | #288 | Tragic 8.7% |
| Iroquois | 0.0 /100 | #289 | Tragic 8.7% |
| Vietnamese | 0.0 /100 | #290 | Tragic 8.8% |
| Jamaicans | 0.0 /100 | #291 | Tragic 8.8% |
| Cheyenne | 0.0 /100 | #292 | Tragic 8.8% |
Demographics Similar to Fijians by Unemployment Among Women with Children Under 6 years
In terms of unemployment among women with children under 6 years, the demographic groups most similar to Fijians are American (9.3%, a difference of 0.030%), Immigrants from the Azores (9.2%, a difference of 0.46%), French American Indian (9.2%, a difference of 0.61%), Cherokee (9.3%, a difference of 0.78%), and Cajun (9.2%, a difference of 0.88%).
| Demographics | Rating | Rank | Unemployment Among Women with Children Under 6 years |
| Dominicans | 0.0 /100 | #307 | Tragic 9.1% |
| Immigrants | Micronesia | 0.0 /100 | #308 | Tragic 9.1% |
| Africans | 0.0 /100 | #309 | Tragic 9.2% |
| Cajuns | 0.0 /100 | #310 | Tragic 9.2% |
| French American Indians | 0.0 /100 | #311 | Tragic 9.2% |
| Immigrants | Azores | 0.0 /100 | #312 | Tragic 9.2% |
| Americans | 0.0 /100 | #313 | Tragic 9.3% |
| Fijians | 0.0 /100 | #314 | Tragic 9.3% |
| Cherokee | 0.0 /100 | #315 | Tragic 9.3% |
| Houma | 0.0 /100 | #316 | Tragic 9.4% |
| Dutch West Indians | 0.0 /100 | #317 | Tragic 9.5% |
| Osage | 0.0 /100 | #318 | Tragic 9.5% |
| Marshallese | 0.0 /100 | #319 | Tragic 9.6% |
| Potawatomi | 0.0 /100 | #320 | Tragic 9.6% |
| Central American Indians | 0.0 /100 | #321 | Tragic 9.6% |