Slovene vs Pennsylvania German Unemployment Among Women with Children Under 6 years
COMPARE
Slovene
Pennsylvania German
Unemployment Among Women with Children Under 6 years
Unemployment Among Women with Children Under 6 years Comparison
Slovenes
Pennsylvania Germans
7.4%
UNEMPLOYMENT AMONG WOMEN WITH CHILDREN UNDER 6 YEARS
89.2/ 100
METRIC RATING
129th/ 347
METRIC RANK
10.8%
UNEMPLOYMENT AMONG WOMEN WITH CHILDREN UNDER 6 YEARS
0.0/ 100
METRIC RATING
330th/ 347
METRIC RANK
Slovene vs Pennsylvania German Unemployment Among Women with Children Under 6 years Correlation Chart
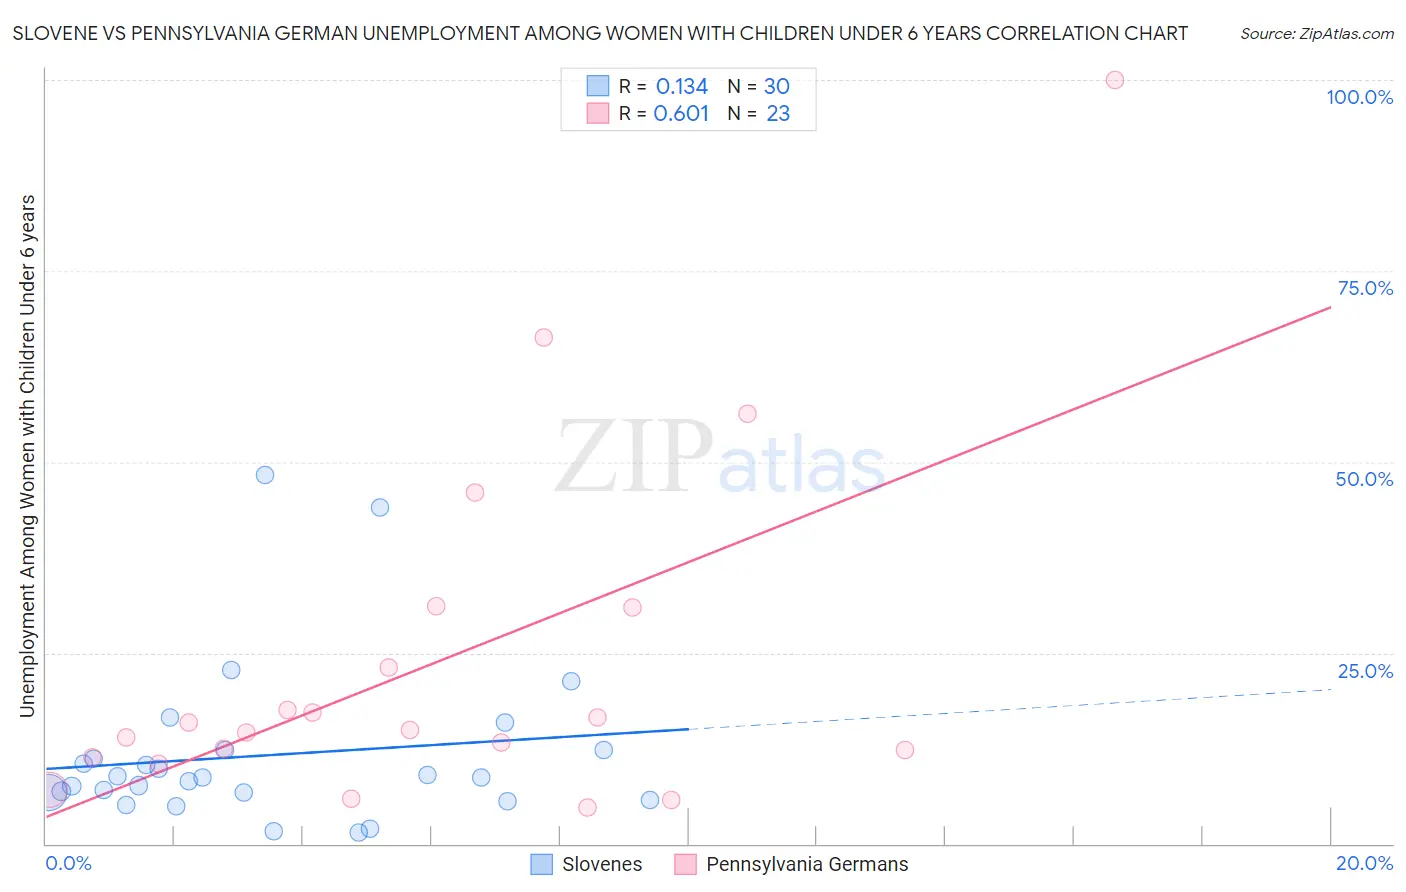
The statistical analysis conducted on geographies consisting of 204,544,718 people shows a poor positive correlation between the proportion of Slovenes and unemployment rate among women with children under the age of 6 in the United States with a correlation coefficient (R) of 0.134 and weighted average of 7.4%. Similarly, the statistical analysis conducted on geographies consisting of 181,724,497 people shows a significant positive correlation between the proportion of Pennsylvania Germans and unemployment rate among women with children under the age of 6 in the United States with a correlation coefficient (R) of 0.601 and weighted average of 10.8%, a difference of 45.9%.
Unemployment Among Women with Children Under 6 years Correlation Summary
| Measurement | Slovene | Pennsylvania German |
| Minimum | 1.4% | 4.7% |
| Maximum | 48.3% | 100.0% |
| Range | 46.9% | 95.3% |
| Mean | 11.6% | 23.8% |
| Median | 8.7% | 14.9% |
| Interquartile 25% (IQ1) | 6.7% | 11.3% |
| Interquartile 75% (IQ3) | 12.2% | 31.0% |
| Interquartile Range (IQR) | 5.5% | 19.7% |
| Standard Deviation (Sample) | 10.6% | 23.1% |
| Standard Deviation (Population) | 10.5% | 22.6% |
Similar Demographics by Unemployment Among Women with Children Under 6 years
Demographics Similar to Slovenes by Unemployment Among Women with Children Under 6 years
In terms of unemployment among women with children under 6 years, the demographic groups most similar to Slovenes are Swedish (7.4%, a difference of 0.14%), Ukrainian (7.4%, a difference of 0.17%), Immigrants from Armenia (7.4%, a difference of 0.30%), Immigrants from Uganda (7.4%, a difference of 0.43%), and Jordanian (7.3%, a difference of 0.45%).
| Demographics | Rating | Rank | Unemployment Among Women with Children Under 6 years |
| Immigrants | Bosnia and Herzegovina | 93.5 /100 | #122 | Exceptional 7.3% |
| Immigrants | Zaire | 93.3 /100 | #123 | Exceptional 7.3% |
| Immigrants | South Africa | 92.5 /100 | #124 | Exceptional 7.3% |
| Pakistanis | 92.2 /100 | #125 | Exceptional 7.3% |
| Immigrants | Burma/Myanmar | 91.9 /100 | #126 | Exceptional 7.3% |
| Jordanians | 91.5 /100 | #127 | Exceptional 7.3% |
| Zimbabweans | 91.5 /100 | #128 | Exceptional 7.3% |
| Slovenes | 89.2 /100 | #129 | Excellent 7.4% |
| Swedes | 88.4 /100 | #130 | Excellent 7.4% |
| Ukrainians | 88.2 /100 | #131 | Excellent 7.4% |
| Immigrants | Armenia | 87.4 /100 | #132 | Excellent 7.4% |
| Immigrants | Uganda | 86.5 /100 | #133 | Excellent 7.4% |
| Immigrants | Bolivia | 85.7 /100 | #134 | Excellent 7.4% |
| Immigrants | Northern Africa | 85.3 /100 | #135 | Excellent 7.4% |
| Immigrants | Morocco | 84.9 /100 | #136 | Excellent 7.4% |
Demographics Similar to Pennsylvania Germans by Unemployment Among Women with Children Under 6 years
In terms of unemployment among women with children under 6 years, the demographic groups most similar to Pennsylvania Germans are Colville (11.2%, a difference of 3.6%), Black/African American (10.3%, a difference of 4.8%), Tohono O'odham (10.2%, a difference of 5.6%), Sioux (11.5%, a difference of 6.4%), and Native/Alaskan (11.5%, a difference of 7.0%).
| Demographics | Rating | Rank | Unemployment Among Women with Children Under 6 years |
| Immigrants | Bahamas | 0.0 /100 | #323 | Tragic 9.6% |
| Paiute | 0.0 /100 | #324 | Tragic 9.7% |
| Choctaw | 0.0 /100 | #325 | Tragic 9.8% |
| Delaware | 0.0 /100 | #326 | Tragic 9.8% |
| Ottawa | 0.0 /100 | #327 | Tragic 9.9% |
| Tohono O'odham | 0.0 /100 | #328 | Tragic 10.2% |
| Blacks/African Americans | 0.0 /100 | #329 | Tragic 10.3% |
| Pennsylvania Germans | 0.0 /100 | #330 | Tragic 10.8% |
| Colville | 0.0 /100 | #331 | Tragic 11.2% |
| Sioux | 0.0 /100 | #332 | Tragic 11.5% |
| Natives/Alaskans | 0.0 /100 | #333 | Tragic 11.5% |
| Apache | 0.0 /100 | #334 | Tragic 12.3% |
| Puerto Ricans | 0.0 /100 | #335 | Tragic 12.5% |
| Shoshone | 0.0 /100 | #336 | Tragic 13.2% |
| Chippewa | 0.0 /100 | #337 | Tragic 13.3% |