U.S. Virgin Islander vs Immigrants from Mexico Seniors Poverty Over the Age of 75
COMPARE
U.S. Virgin Islander
Immigrants from Mexico
Seniors Poverty Over the Age of 75
Seniors Poverty Over the Age of 75 Comparison
U.S. Virgin Islanders
Immigrants from Mexico
15.4%
SENIORS POVERTY OVER THE AGE OF 75
0.0/ 100
METRIC RATING
295th/ 347
METRIC RANK
14.9%
SENIORS POVERTY OVER THE AGE OF 75
0.0/ 100
METRIC RATING
285th/ 347
METRIC RANK
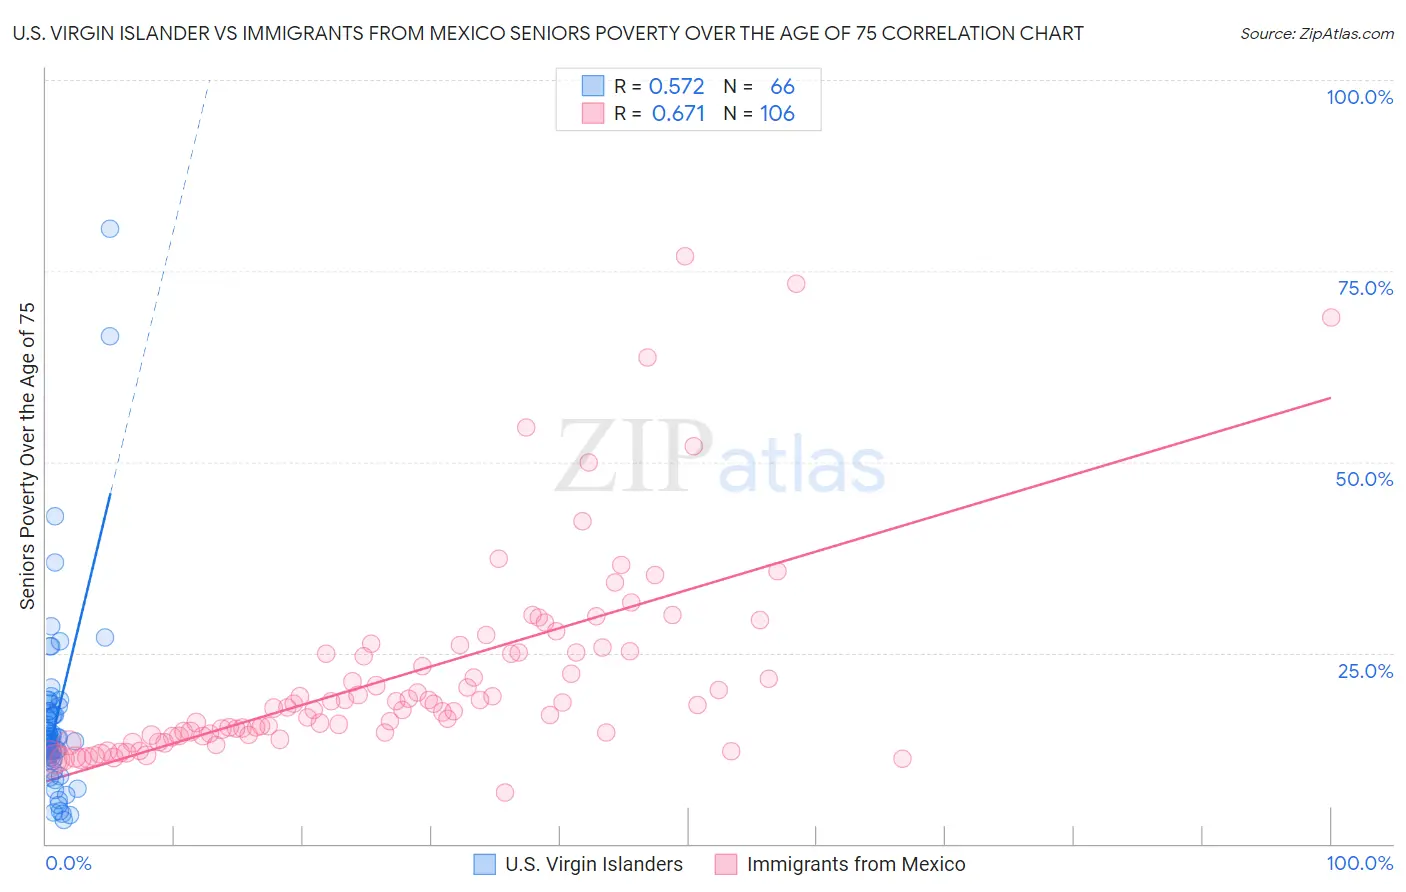
U.S. Virgin Islander vs Immigrants from Mexico Seniors Poverty Over the Age of 75 Correlation Chart
The statistical analysis conducted on geographies consisting of 87,346,721 people shows a substantial positive correlation between the proportion of U.S. Virgin Islanders and poverty level among seniors over the age of 75 in the United States with a correlation coefficient (R) of 0.572 and weighted average of 15.4%. Similarly, the statistical analysis conducted on geographies consisting of 503,324,088 people shows a significant positive correlation between the proportion of Immigrants from Mexico and poverty level among seniors over the age of 75 in the United States with a correlation coefficient (R) of 0.671 and weighted average of 14.9%, a difference of 3.1%.
Seniors Poverty Over the Age of 75 Correlation Summary
| Measurement | U.S. Virgin Islander | Immigrants from Mexico |
| Minimum | 3.0% | 6.8% |
| Maximum | 80.5% | 76.9% |
| Range | 77.5% | 70.1% |
| Mean | 16.3% | 21.9% |
| Median | 13.8% | 18.0% |
| Interquartile 25% (IQ1) | 11.2% | 14.2% |
| Interquartile 75% (IQ3) | 17.3% | 25.1% |
| Interquartile Range (IQR) | 6.1% | 10.9% |
| Standard Deviation (Sample) | 12.6% | 13.1% |
| Standard Deviation (Population) | 12.5% | 13.1% |
Demographics Similar to U.S. Virgin Islanders and Immigrants from Mexico by Seniors Poverty Over the Age of 75
In terms of seniors poverty over the age of 75, the demographic groups most similar to U.S. Virgin Islanders are Yuman (15.4%, a difference of 0.18%), Immigrants from Jamaica (15.3%, a difference of 0.19%), Honduran (15.4%, a difference of 0.46%), Apache (15.3%, a difference of 0.64%), and Native/Alaskan (15.5%, a difference of 0.80%). Similarly, the demographic groups most similar to Immigrants from Mexico are Cheyenne (14.9%, a difference of 0.19%), Immigrants from Central America (15.0%, a difference of 0.33%), Guatemalan (14.8%, a difference of 0.83%), Immigrants from Senegal (14.8%, a difference of 0.89%), and Immigrants from Guatemala (15.1%, a difference of 0.93%).
| Demographics | Rating | Rank | Seniors Poverty Over the Age of 75 |
| Central Americans | 0.0 /100 | #280 | Tragic 14.7% |
| Belizeans | 0.0 /100 | #281 | Tragic 14.8% |
| Immigrants | Senegal | 0.0 /100 | #282 | Tragic 14.8% |
| Guatemalans | 0.0 /100 | #283 | Tragic 14.8% |
| Cheyenne | 0.0 /100 | #284 | Tragic 14.9% |
| Immigrants | Mexico | 0.0 /100 | #285 | Tragic 14.9% |
| Immigrants | Central America | 0.0 /100 | #286 | Tragic 15.0% |
| Immigrants | Guatemala | 0.0 /100 | #287 | Tragic 15.1% |
| Jamaicans | 0.0 /100 | #288 | Tragic 15.1% |
| Immigrants | Belize | 0.0 /100 | #289 | Tragic 15.2% |
| Immigrants | Azores | 0.0 /100 | #290 | Tragic 15.2% |
| Paiute | 0.0 /100 | #291 | Tragic 15.2% |
| Colville | 0.0 /100 | #292 | Tragic 15.2% |
| Apache | 0.0 /100 | #293 | Tragic 15.3% |
| Immigrants | Jamaica | 0.0 /100 | #294 | Tragic 15.3% |
| U.S. Virgin Islanders | 0.0 /100 | #295 | Tragic 15.4% |
| Yuman | 0.0 /100 | #296 | Tragic 15.4% |
| Hondurans | 0.0 /100 | #297 | Tragic 15.4% |
| Natives/Alaskans | 0.0 /100 | #298 | Tragic 15.5% |
| Spanish American Indians | 0.0 /100 | #299 | Tragic 15.5% |
| Bahamians | 0.0 /100 | #300 | Tragic 15.5% |