Ugandan vs Welsh Unemployment Among Seniors over 75 years
COMPARE
Ugandan
Welsh
Unemployment Among Seniors over 75 years
Unemployment Among Seniors over 75 years Comparison
Ugandans
Welsh
7.7%
UNEMPLOYMENT AMONG SENIORS OVER 75 YEARS
100.0/ 100
METRIC RATING
39th/ 347
METRIC RANK
10.0%
UNEMPLOYMENT AMONG SENIORS OVER 75 YEARS
0.0/ 100
METRIC RATING
301st/ 347
METRIC RANK
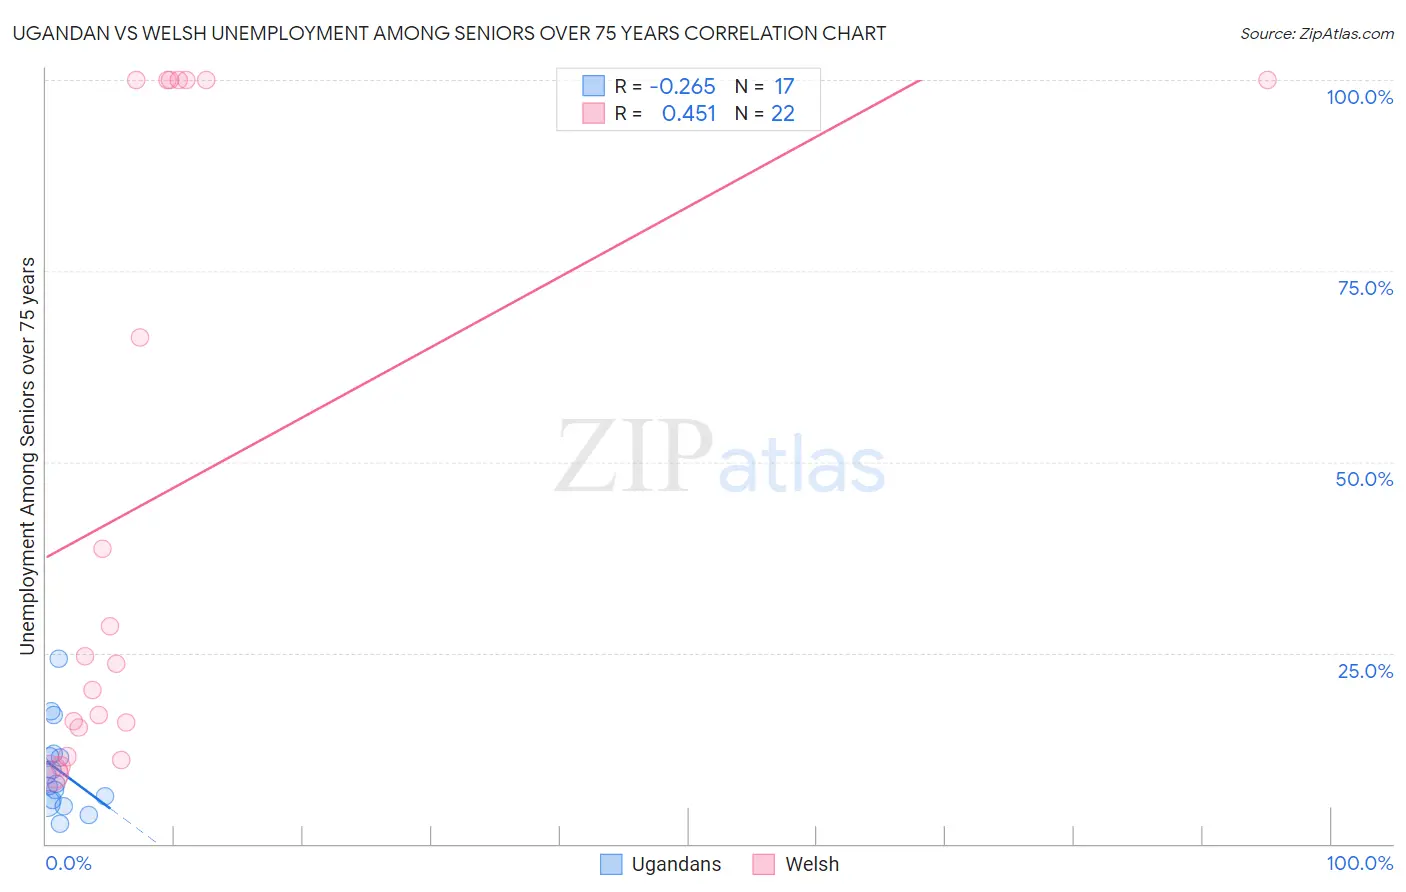
Ugandan vs Welsh Unemployment Among Seniors over 75 years Correlation Chart
The statistical analysis conducted on geographies consisting of 74,859,637 people shows a weak negative correlation between the proportion of Ugandans and unemployment rate among seniors over the age of 75 in the United States with a correlation coefficient (R) of -0.265 and weighted average of 7.7%. Similarly, the statistical analysis conducted on geographies consisting of 226,491,024 people shows a moderate positive correlation between the proportion of Welsh and unemployment rate among seniors over the age of 75 in the United States with a correlation coefficient (R) of 0.451 and weighted average of 10.0%, a difference of 29.1%.
Unemployment Among Seniors over 75 years Correlation Summary
| Measurement | Ugandan | Welsh |
| Minimum | 2.7% | 9.1% |
| Maximum | 24.3% | 100.0% |
| Range | 21.6% | 90.9% |
| Mean | 9.6% | 46.2% |
| Median | 7.8% | 24.1% |
| Interquartile 25% (IQ1) | 5.5% | 15.2% |
| Interquartile 75% (IQ3) | 11.6% | 100.0% |
| Interquartile Range (IQR) | 6.1% | 84.8% |
| Standard Deviation (Sample) | 5.6% | 39.6% |
| Standard Deviation (Population) | 5.4% | 38.6% |
Similar Demographics by Unemployment Among Seniors over 75 years
Demographics Similar to Ugandans by Unemployment Among Seniors over 75 years
In terms of unemployment among seniors over 75 years, the demographic groups most similar to Ugandans are Colville (7.7%, a difference of 0.020%), Kiowa (7.7%, a difference of 0.040%), Immigrants from Hungary (7.7%, a difference of 0.050%), Immigrants from Burma/Myanmar (7.7%, a difference of 0.16%), and Luxembourger (7.7%, a difference of 0.25%).
| Demographics | Rating | Rank | Unemployment Among Seniors over 75 years |
| Immigrants | Hong Kong | 100.0 /100 | #32 | Exceptional 7.6% |
| Cambodians | 100.0 /100 | #33 | Exceptional 7.6% |
| Immigrants | Eritrea | 100.0 /100 | #34 | Exceptional 7.7% |
| Immigrants | Norway | 100.0 /100 | #35 | Exceptional 7.7% |
| Luxembourgers | 100.0 /100 | #36 | Exceptional 7.7% |
| Immigrants | Hungary | 100.0 /100 | #37 | Exceptional 7.7% |
| Kiowa | 100.0 /100 | #38 | Exceptional 7.7% |
| Ugandans | 100.0 /100 | #39 | Exceptional 7.7% |
| Colville | 100.0 /100 | #40 | Exceptional 7.7% |
| Immigrants | Burma/Myanmar | 100.0 /100 | #41 | Exceptional 7.7% |
| Pueblo | 100.0 /100 | #42 | Exceptional 7.7% |
| Immigrants | Denmark | 100.0 /100 | #43 | Exceptional 7.8% |
| Immigrants | Spain | 100.0 /100 | #44 | Exceptional 7.8% |
| British West Indians | 100.0 /100 | #45 | Exceptional 7.8% |
| Immigrants | China | 100.0 /100 | #46 | Exceptional 7.8% |
Demographics Similar to Welsh by Unemployment Among Seniors over 75 years
In terms of unemployment among seniors over 75 years, the demographic groups most similar to Welsh are Finnish (10.0%, a difference of 0.11%), Puget Sound Salish (10.0%, a difference of 0.18%), Scotch-Irish (10.0%, a difference of 0.19%), Swedish (10.0%, a difference of 0.38%), and Iraqi (9.9%, a difference of 0.42%).
| Demographics | Rating | Rank | Unemployment Among Seniors over 75 years |
| Immigrants | Dominica | 0.0 /100 | #294 | Tragic 9.8% |
| Immigrants | Nonimmigrants | 0.0 /100 | #295 | Tragic 9.8% |
| Immigrants | St. Vincent and the Grenadines | 0.0 /100 | #296 | Tragic 9.8% |
| Cherokee | 0.0 /100 | #297 | Tragic 9.8% |
| Lithuanians | 0.0 /100 | #298 | Tragic 9.9% |
| Belgians | 0.0 /100 | #299 | Tragic 9.9% |
| Iraqis | 0.0 /100 | #300 | Tragic 9.9% |
| Welsh | 0.0 /100 | #301 | Tragic 10.0% |
| Finns | 0.0 /100 | #302 | Tragic 10.0% |
| Puget Sound Salish | 0.0 /100 | #303 | Tragic 10.0% |
| Scotch-Irish | 0.0 /100 | #304 | Tragic 10.0% |
| Swedes | 0.0 /100 | #305 | Tragic 10.0% |
| Italians | 0.0 /100 | #306 | Tragic 10.0% |
| Immigrants | Fiji | 0.0 /100 | #307 | Tragic 10.0% |
| Whites/Caucasians | 0.0 /100 | #308 | Tragic 10.1% |