Serbian vs Palestinian Unemployment Among Seniors over 75 years
COMPARE
Serbian
Palestinian
Unemployment Among Seniors over 75 years
Unemployment Among Seniors over 75 years Comparison
Serbians
Palestinians
8.4%
UNEMPLOYMENT AMONG SENIORS OVER 75 YEARS
93.7/ 100
METRIC RATING
133rd/ 347
METRIC RANK
9.3%
UNEMPLOYMENT AMONG SENIORS OVER 75 YEARS
0.6/ 100
METRIC RATING
265th/ 347
METRIC RANK
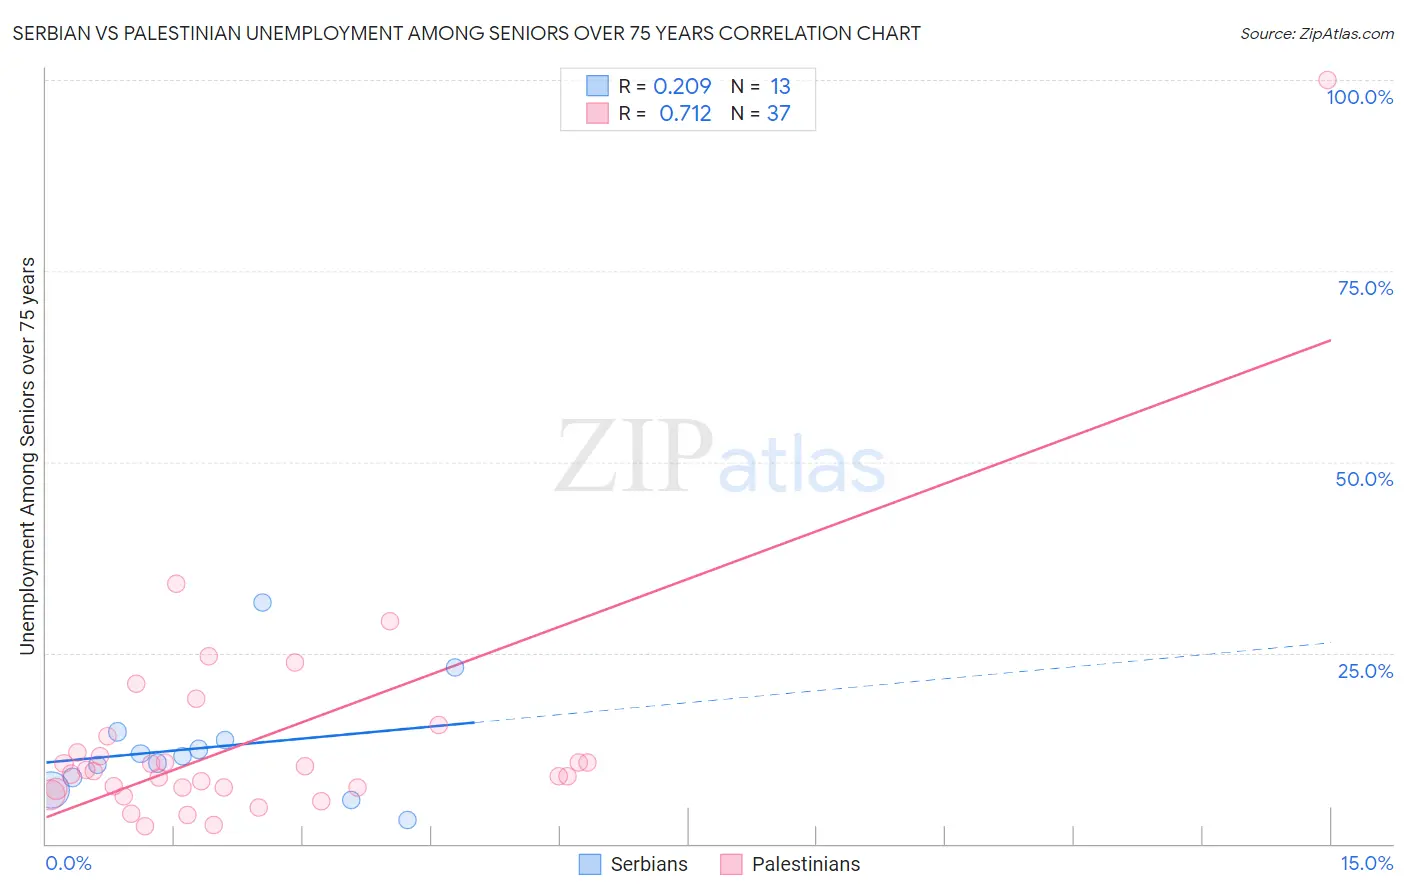
Serbian vs Palestinian Unemployment Among Seniors over 75 years Correlation Chart
The statistical analysis conducted on geographies consisting of 156,247,498 people shows a weak positive correlation between the proportion of Serbians and unemployment rate among seniors over the age of 75 in the United States with a correlation coefficient (R) of 0.209 and weighted average of 8.4%. Similarly, the statistical analysis conducted on geographies consisting of 136,961,824 people shows a strong positive correlation between the proportion of Palestinians and unemployment rate among seniors over the age of 75 in the United States with a correlation coefficient (R) of 0.712 and weighted average of 9.3%, a difference of 10.8%.
Unemployment Among Seniors over 75 years Correlation Summary
| Measurement | Serbian | Palestinian |
| Minimum | 3.1% | 2.3% |
| Maximum | 31.6% | 100.0% |
| Range | 28.5% | 97.7% |
| Mean | 12.6% | 13.6% |
| Median | 11.5% | 9.5% |
| Interquartile 25% (IQ1) | 7.9% | 7.3% |
| Interquartile 75% (IQ3) | 14.1% | 13.0% |
| Interquartile Range (IQR) | 6.3% | 5.7% |
| Standard Deviation (Sample) | 7.5% | 16.3% |
| Standard Deviation (Population) | 7.2% | 16.1% |
Similar Demographics by Unemployment Among Seniors over 75 years
Demographics Similar to Serbians by Unemployment Among Seniors over 75 years
In terms of unemployment among seniors over 75 years, the demographic groups most similar to Serbians are Chilean (8.4%, a difference of 0.030%), Immigrants from Czechoslovakia (8.4%, a difference of 0.080%), German Russian (8.4%, a difference of 0.31%), Apache (8.4%, a difference of 0.39%), and Haitian (8.5%, a difference of 0.47%).
| Demographics | Rating | Rank | Unemployment Among Seniors over 75 years |
| Belizeans | 96.3 /100 | #126 | Exceptional 8.4% |
| Hondurans | 96.2 /100 | #127 | Exceptional 8.4% |
| Native Hawaiians | 96.1 /100 | #128 | Exceptional 8.4% |
| Ghanaians | 96.0 /100 | #129 | Exceptional 8.4% |
| Apache | 95.2 /100 | #130 | Exceptional 8.4% |
| German Russians | 94.9 /100 | #131 | Exceptional 8.4% |
| Chileans | 93.8 /100 | #132 | Exceptional 8.4% |
| Serbians | 93.7 /100 | #133 | Exceptional 8.4% |
| Immigrants | Czechoslovakia | 93.4 /100 | #134 | Exceptional 8.4% |
| Haitians | 91.4 /100 | #135 | Exceptional 8.5% |
| Immigrants | Trinidad and Tobago | 90.8 /100 | #136 | Exceptional 8.5% |
| Immigrants | Kuwait | 90.5 /100 | #137 | Exceptional 8.5% |
| Immigrants | Bulgaria | 89.6 /100 | #138 | Excellent 8.5% |
| Barbadians | 88.6 /100 | #139 | Excellent 8.5% |
| South Americans | 87.9 /100 | #140 | Excellent 8.5% |
Demographics Similar to Palestinians by Unemployment Among Seniors over 75 years
In terms of unemployment among seniors over 75 years, the demographic groups most similar to Palestinians are Iroquois (9.3%, a difference of 0.12%), Ukrainian (9.3%, a difference of 0.13%), Austrian (9.3%, a difference of 0.25%), Black/African American (9.4%, a difference of 0.32%), and Celtic (9.3%, a difference of 0.36%).
| Demographics | Rating | Rank | Unemployment Among Seniors over 75 years |
| Immigrants | England | 1.0 /100 | #258 | Tragic 9.3% |
| Slovenes | 1.0 /100 | #259 | Tragic 9.3% |
| Immigrants | Cameroon | 1.0 /100 | #260 | Tragic 9.3% |
| Celtics | 0.8 /100 | #261 | Tragic 9.3% |
| Austrians | 0.7 /100 | #262 | Tragic 9.3% |
| Ukrainians | 0.7 /100 | #263 | Tragic 9.3% |
| Iroquois | 0.7 /100 | #264 | Tragic 9.3% |
| Palestinians | 0.6 /100 | #265 | Tragic 9.3% |
| Blacks/African Americans | 0.5 /100 | #266 | Tragic 9.4% |
| Immigrants | Mexico | 0.4 /100 | #267 | Tragic 9.4% |
| Greeks | 0.4 /100 | #268 | Tragic 9.4% |
| Puerto Ricans | 0.3 /100 | #269 | Tragic 9.4% |
| Yaqui | 0.3 /100 | #270 | Tragic 9.4% |
| Bulgarians | 0.3 /100 | #271 | Tragic 9.4% |
| Immigrants | Iraq | 0.3 /100 | #272 | Tragic 9.4% |