Ugandan vs Immigrants from El Salvador Unemployment Among Women with Children Under 6 years
COMPARE
Ugandan
Immigrants from El Salvador
Unemployment Among Women with Children Under 6 years
Unemployment Among Women with Children Under 6 years Comparison
Ugandans
Immigrants from El Salvador
7.6%
UNEMPLOYMENT AMONG WOMEN WITH CHILDREN UNDER 6 YEARS
65.8/ 100
METRIC RATING
164th/ 347
METRIC RANK
8.1%
UNEMPLOYMENT AMONG WOMEN WITH CHILDREN UNDER 6 YEARS
2.6/ 100
METRIC RATING
240th/ 347
METRIC RANK
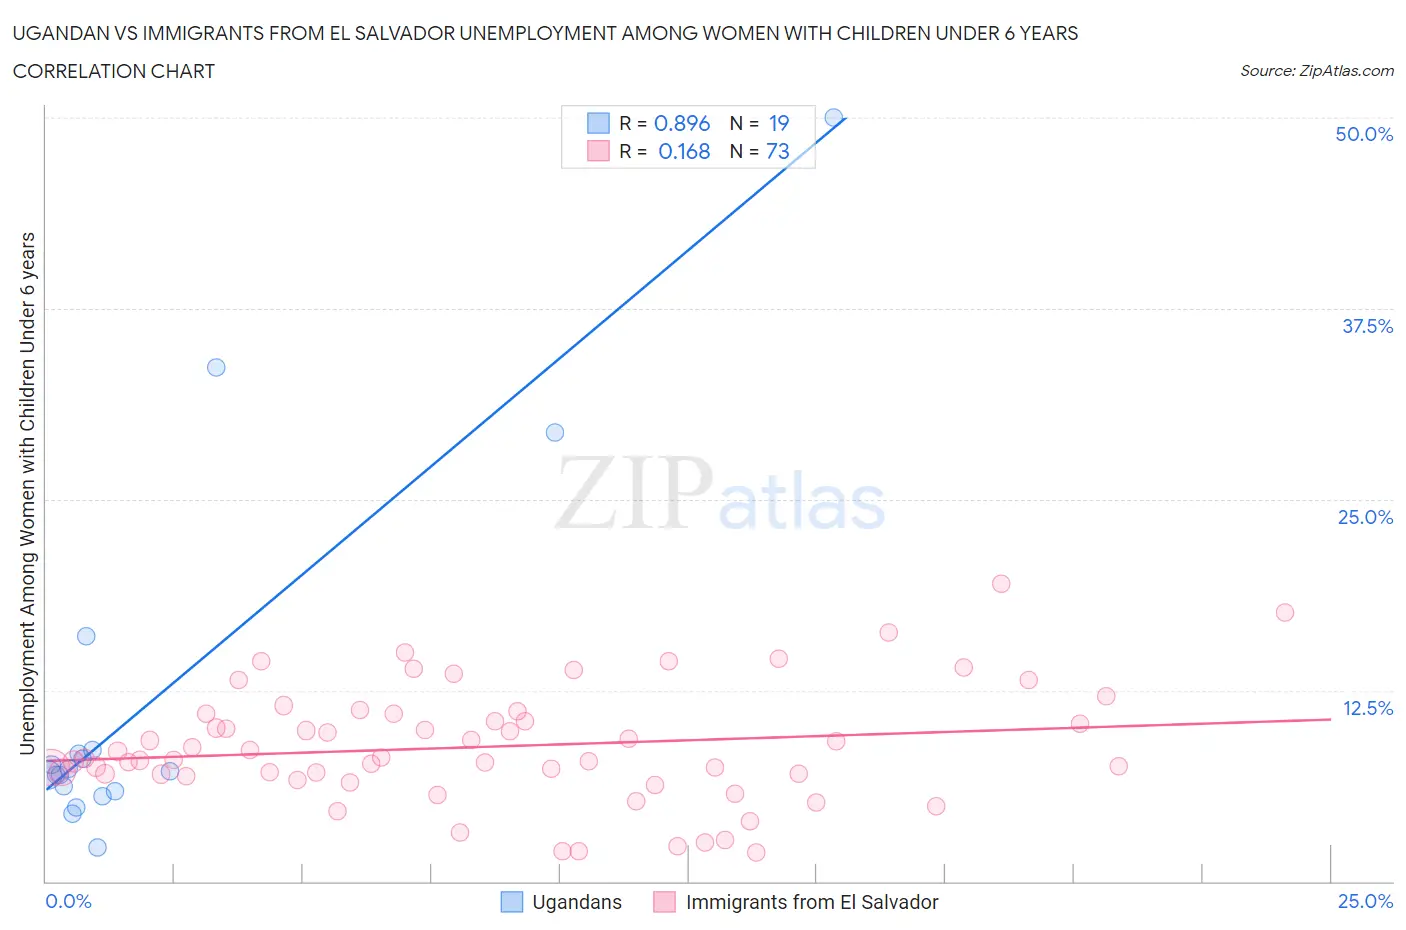
Ugandan vs Immigrants from El Salvador Unemployment Among Women with Children Under 6 years Correlation Chart
The statistical analysis conducted on geographies consisting of 86,756,193 people shows a very strong positive correlation between the proportion of Ugandans and unemployment rate among women with children under the age of 6 in the United States with a correlation coefficient (R) of 0.896 and weighted average of 7.6%. Similarly, the statistical analysis conducted on geographies consisting of 286,042,904 people shows a poor positive correlation between the proportion of Immigrants from El Salvador and unemployment rate among women with children under the age of 6 in the United States with a correlation coefficient (R) of 0.168 and weighted average of 8.1%, a difference of 7.1%.
Unemployment Among Women with Children Under 6 years Correlation Summary
| Measurement | Ugandan | Immigrants from El Salvador |
| Minimum | 2.2% | 1.9% |
| Maximum | 50.0% | 19.5% |
| Range | 47.8% | 17.6% |
| Mean | 11.9% | 8.8% |
| Median | 7.2% | 8.1% |
| Interquartile 25% (IQ1) | 5.9% | 7.0% |
| Interquartile 75% (IQ3) | 8.6% | 10.9% |
| Interquartile Range (IQR) | 2.7% | 4.0% |
| Standard Deviation (Sample) | 12.3% | 3.8% |
| Standard Deviation (Population) | 12.0% | 3.7% |
Similar Demographics by Unemployment Among Women with Children Under 6 years
Demographics Similar to Ugandans by Unemployment Among Women with Children Under 6 years
In terms of unemployment among women with children under 6 years, the demographic groups most similar to Ugandans are Immigrants from South America (7.6%, a difference of 0.020%), British (7.6%, a difference of 0.040%), Belgian (7.6%, a difference of 0.17%), Immigrants from Lithuania (7.5%, a difference of 0.23%), and Kenyan (7.6%, a difference of 0.24%).
| Demographics | Rating | Rank | Unemployment Among Women with Children Under 6 years |
| Peruvians | 72.3 /100 | #157 | Good 7.5% |
| Croatians | 71.9 /100 | #158 | Good 7.5% |
| Immigrants | Philippines | 71.3 /100 | #159 | Good 7.5% |
| Bolivians | 70.8 /100 | #160 | Good 7.5% |
| Immigrants | Western Asia | 70.2 /100 | #161 | Good 7.5% |
| Immigrants | Lithuania | 68.8 /100 | #162 | Good 7.5% |
| British | 66.3 /100 | #163 | Good 7.6% |
| Ugandans | 65.8 /100 | #164 | Good 7.6% |
| Immigrants | South America | 65.6 /100 | #165 | Good 7.6% |
| Belgians | 63.5 /100 | #166 | Good 7.6% |
| Kenyans | 62.5 /100 | #167 | Good 7.6% |
| Immigrants | Canada | 61.6 /100 | #168 | Good 7.6% |
| Immigrants | Scotland | 61.3 /100 | #169 | Good 7.6% |
| Czechs | 59.8 /100 | #170 | Average 7.6% |
| Immigrants | Grenada | 59.0 /100 | #171 | Average 7.6% |
Demographics Similar to Immigrants from El Salvador by Unemployment Among Women with Children Under 6 years
In terms of unemployment among women with children under 6 years, the demographic groups most similar to Immigrants from El Salvador are Liberian (8.1%, a difference of 0.030%), Irish (8.1%, a difference of 0.070%), Dutch (8.1%, a difference of 0.080%), Immigrants from Middle Africa (8.1%, a difference of 0.34%), and Hawaiian (8.2%, a difference of 0.64%).
| Demographics | Rating | Rank | Unemployment Among Women with Children Under 6 years |
| Immigrants | Trinidad and Tobago | 4.8 /100 | #233 | Tragic 8.0% |
| Kiowa | 4.4 /100 | #234 | Tragic 8.0% |
| Comanche | 4.3 /100 | #235 | Tragic 8.0% |
| Immigrants | Barbados | 4.2 /100 | #236 | Tragic 8.0% |
| Immigrants | Costa Rica | 4.1 /100 | #237 | Tragic 8.0% |
| Immigrants | Middle Africa | 3.2 /100 | #238 | Tragic 8.1% |
| Irish | 2.7 /100 | #239 | Tragic 8.1% |
| Immigrants | El Salvador | 2.6 /100 | #240 | Tragic 8.1% |
| Liberians | 2.6 /100 | #241 | Tragic 8.1% |
| Dutch | 2.5 /100 | #242 | Tragic 8.1% |
| Hawaiians | 1.8 /100 | #243 | Tragic 8.2% |
| French | 1.7 /100 | #244 | Tragic 8.2% |
| Native Hawaiians | 1.7 /100 | #245 | Tragic 8.2% |
| Central Americans | 1.4 /100 | #246 | Tragic 8.2% |
| German Russians | 1.2 /100 | #247 | Tragic 8.2% |