Turkish vs Carpatho Rusyn Unemployment Among Youth under 25 years
COMPARE
Turkish
Carpatho Rusyn
Unemployment Among Youth under 25 years
Unemployment Among Youth under 25 years Comparison
Turks
Carpatho Rusyns
11.4%
UNEMPLOYMENT AMONG YOUTH UNDER 25 YEARS
85.8/ 100
METRIC RATING
129th/ 347
METRIC RANK
11.3%
UNEMPLOYMENT AMONG YOUTH UNDER 25 YEARS
94.4/ 100
METRIC RATING
95th/ 347
METRIC RANK
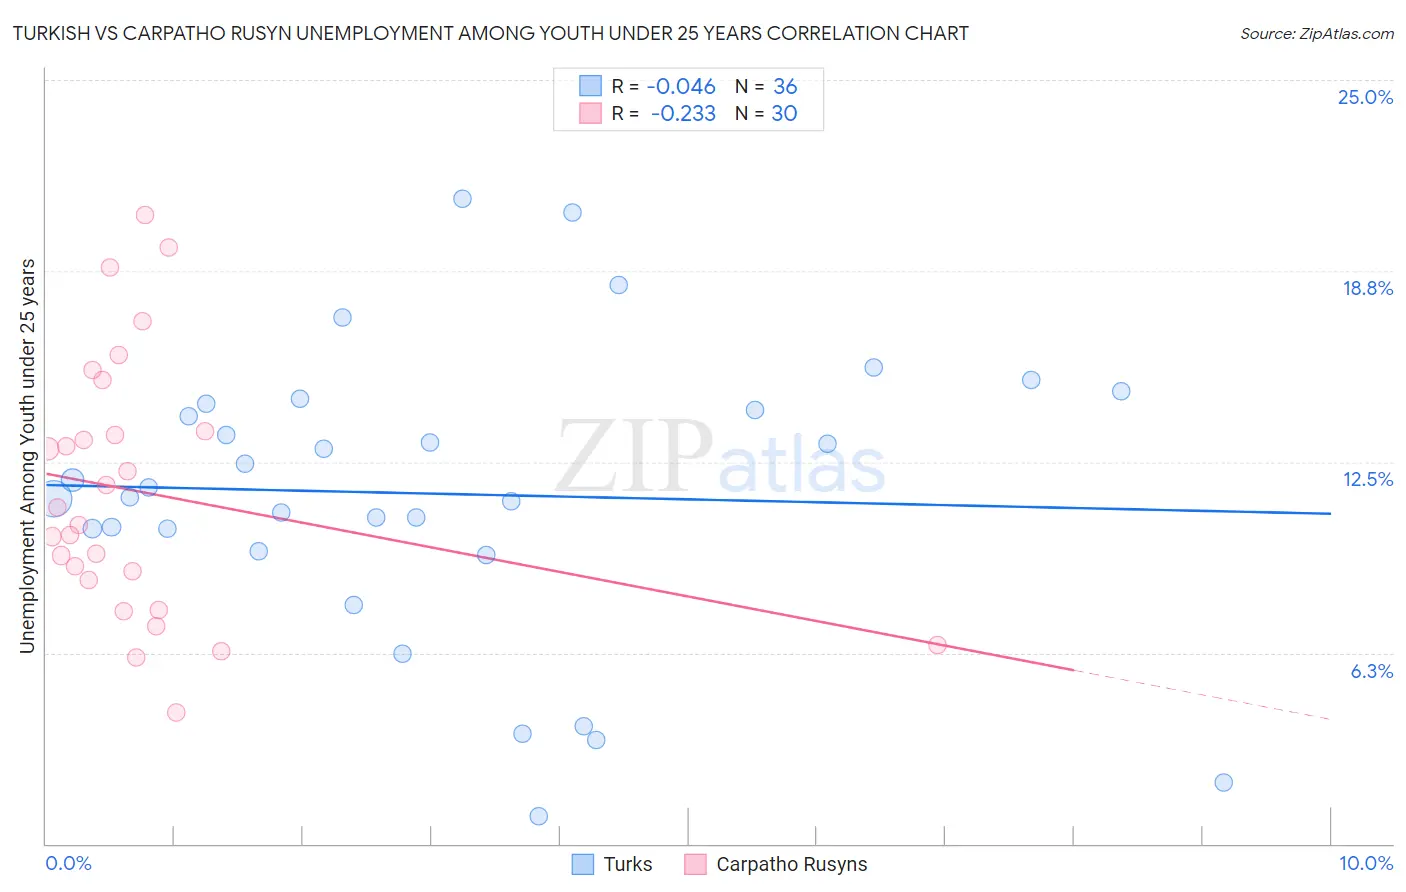
Turkish vs Carpatho Rusyn Unemployment Among Youth under 25 years Correlation Chart
The statistical analysis conducted on geographies consisting of 269,922,235 people shows no correlation between the proportion of Turks and unemployment rate among youth under the age of 25 in the United States with a correlation coefficient (R) of -0.046 and weighted average of 11.4%. Similarly, the statistical analysis conducted on geographies consisting of 58,593,432 people shows a weak negative correlation between the proportion of Carpatho Rusyns and unemployment rate among youth under the age of 25 in the United States with a correlation coefficient (R) of -0.233 and weighted average of 11.3%, a difference of 1.1%.
Unemployment Among Youth under 25 years Correlation Summary
| Measurement | Turkish | Carpatho Rusyn |
| Minimum | 0.90% | 4.3% |
| Maximum | 21.1% | 20.6% |
| Range | 20.2% | 16.3% |
| Mean | 11.5% | 11.5% |
| Median | 11.5% | 10.7% |
| Interquartile 25% (IQ1) | 9.9% | 8.6% |
| Interquartile 75% (IQ3) | 14.3% | 13.5% |
| Interquartile Range (IQR) | 4.4% | 4.9% |
| Standard Deviation (Sample) | 4.7% | 4.2% |
| Standard Deviation (Population) | 4.7% | 4.1% |
Similar Demographics by Unemployment Among Youth under 25 years
Demographics Similar to Turks by Unemployment Among Youth under 25 years
In terms of unemployment among youth under 25 years, the demographic groups most similar to Turks are Hungarian (11.4%, a difference of 0.010%), Immigrants from Hungary (11.4%, a difference of 0.020%), Greek (11.4%, a difference of 0.030%), Canadian (11.4%, a difference of 0.070%), and Immigrants from Spain (11.4%, a difference of 0.10%).
| Demographics | Rating | Rank | Unemployment Among Youth under 25 years |
| Immigrants | Micronesia | 88.1 /100 | #122 | Excellent 11.4% |
| Basques | 87.8 /100 | #123 | Excellent 11.4% |
| Italians | 87.2 /100 | #124 | Excellent 11.4% |
| Immigrants | Argentina | 87.2 /100 | #125 | Excellent 11.4% |
| Canadians | 86.6 /100 | #126 | Excellent 11.4% |
| Greeks | 86.2 /100 | #127 | Excellent 11.4% |
| Immigrants | Hungary | 86.0 /100 | #128 | Excellent 11.4% |
| Turks | 85.8 /100 | #129 | Excellent 11.4% |
| Hungarians | 85.7 /100 | #130 | Excellent 11.4% |
| Immigrants | Spain | 84.6 /100 | #131 | Excellent 11.4% |
| Ethiopians | 83.2 /100 | #132 | Excellent 11.4% |
| Lebanese | 83.1 /100 | #133 | Excellent 11.4% |
| Immigrants | Chile | 80.4 /100 | #134 | Excellent 11.4% |
| Immigrants | Oceania | 80.2 /100 | #135 | Excellent 11.4% |
| Romanians | 80.1 /100 | #136 | Excellent 11.4% |
Demographics Similar to Carpatho Rusyns by Unemployment Among Youth under 25 years
In terms of unemployment among youth under 25 years, the demographic groups most similar to Carpatho Rusyns are Immigrants from Serbia (11.3%, a difference of 0.010%), Nicaraguan (11.3%, a difference of 0.030%), Estonian (11.3%, a difference of 0.040%), Lithuanian (11.3%, a difference of 0.070%), and Celtic (11.3%, a difference of 0.090%).
| Demographics | Rating | Rank | Unemployment Among Youth under 25 years |
| Austrians | 95.5 /100 | #88 | Exceptional 11.2% |
| Immigrants | Japan | 95.5 /100 | #89 | Exceptional 11.2% |
| Immigrants | Bolivia | 95.5 /100 | #90 | Exceptional 11.2% |
| Immigrants | Taiwan | 95.1 /100 | #91 | Exceptional 11.2% |
| Immigrants | Latvia | 95.1 /100 | #92 | Exceptional 11.2% |
| Immigrants | North America | 95.1 /100 | #93 | Exceptional 11.2% |
| Lithuanians | 94.8 /100 | #94 | Exceptional 11.3% |
| Carpatho Rusyns | 94.4 /100 | #95 | Exceptional 11.3% |
| Immigrants | Serbia | 94.4 /100 | #96 | Exceptional 11.3% |
| Nicaraguans | 94.3 /100 | #97 | Exceptional 11.3% |
| Estonians | 94.2 /100 | #98 | Exceptional 11.3% |
| Celtics | 94.0 /100 | #99 | Exceptional 11.3% |
| Pakistanis | 94.0 /100 | #100 | Exceptional 11.3% |
| Iroquois | 93.8 /100 | #101 | Exceptional 11.3% |
| Immigrants | Thailand | 93.6 /100 | #102 | Exceptional 11.3% |