Turkish vs Immigrants from Dominica Female Unemployment
COMPARE
Turkish
Immigrants from Dominica
Female Unemployment
Female Unemployment Comparison
Turks
Immigrants from Dominica
5.0%
FEMALE UNEMPLOYMENT
97.6/ 100
METRIC RATING
79th/ 347
METRIC RANK
6.5%
FEMALE UNEMPLOYMENT
0.0/ 100
METRIC RATING
320th/ 347
METRIC RANK
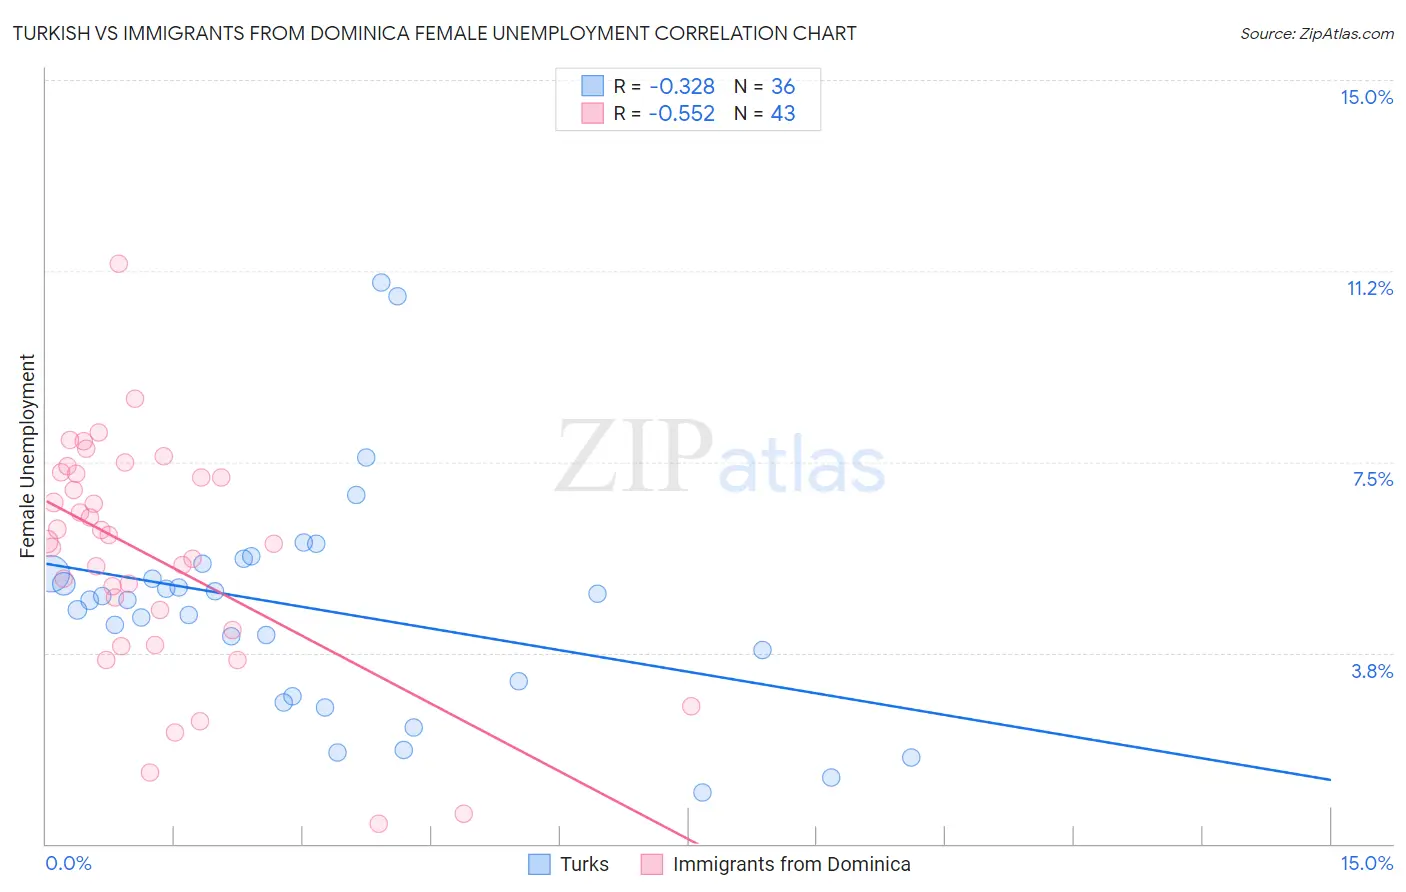
Turkish vs Immigrants from Dominica Female Unemployment Correlation Chart
The statistical analysis conducted on geographies consisting of 271,277,320 people shows a mild negative correlation between the proportion of Turks and unemploymnet rate among females in the United States with a correlation coefficient (R) of -0.328 and weighted average of 5.0%. Similarly, the statistical analysis conducted on geographies consisting of 83,755,488 people shows a substantial negative correlation between the proportion of Immigrants from Dominica and unemploymnet rate among females in the United States with a correlation coefficient (R) of -0.552 and weighted average of 6.5%, a difference of 30.0%.
Female Unemployment Correlation Summary
| Measurement | Turkish | Immigrants from Dominica |
| Minimum | 1.0% | 0.40% |
| Maximum | 11.0% | 11.4% |
| Range | 10.0% | 11.0% |
| Mean | 4.6% | 5.6% |
| Median | 4.8% | 5.9% |
| Interquartile 25% (IQ1) | 3.0% | 4.2% |
| Interquartile 75% (IQ3) | 5.4% | 7.3% |
| Interquartile Range (IQR) | 2.3% | 3.1% |
| Standard Deviation (Sample) | 2.2% | 2.2% |
| Standard Deviation (Population) | 2.2% | 2.2% |
Similar Demographics by Female Unemployment
Demographics Similar to Turks by Female Unemployment
In terms of female unemployment, the demographic groups most similar to Turks are New Zealander (5.0%, a difference of 0.12%), Filipino (5.0%, a difference of 0.14%), Immigrants from Netherlands (5.0%, a difference of 0.18%), Mongolian (5.0%, a difference of 0.19%), and Immigrants from Australia (5.0%, a difference of 0.19%).
| Demographics | Rating | Rank | Female Unemployment |
| Immigrants | Northern Europe | 98.0 /100 | #72 | Exceptional 4.9% |
| Russians | 98.0 /100 | #73 | Exceptional 5.0% |
| Immigrants | Bolivia | 98.0 /100 | #74 | Exceptional 5.0% |
| Immigrants | Singapore | 98.0 /100 | #75 | Exceptional 5.0% |
| Immigrants | Venezuela | 97.9 /100 | #76 | Exceptional 5.0% |
| Mongolians | 97.8 /100 | #77 | Exceptional 5.0% |
| Immigrants | Netherlands | 97.8 /100 | #78 | Exceptional 5.0% |
| Turks | 97.6 /100 | #79 | Exceptional 5.0% |
| New Zealanders | 97.4 /100 | #80 | Exceptional 5.0% |
| Filipinos | 97.3 /100 | #81 | Exceptional 5.0% |
| Immigrants | Australia | 97.3 /100 | #82 | Exceptional 5.0% |
| Immigrants | Serbia | 97.2 /100 | #83 | Exceptional 5.0% |
| Canadians | 97.2 /100 | #84 | Exceptional 5.0% |
| Ukrainians | 97.1 /100 | #85 | Exceptional 5.0% |
| Bolivians | 97.1 /100 | #86 | Exceptional 5.0% |
Demographics Similar to Immigrants from Dominica by Female Unemployment
In terms of female unemployment, the demographic groups most similar to Immigrants from Dominica are Immigrants from Bangladesh (6.5%, a difference of 0.010%), British West Indian (6.4%, a difference of 0.20%), Immigrants from St. Vincent and the Grenadines (6.4%, a difference of 0.48%), Black/African American (6.5%, a difference of 0.54%), and Vietnamese (6.5%, a difference of 0.62%).
| Demographics | Rating | Rank | Female Unemployment |
| Belizeans | 0.0 /100 | #313 | Tragic 6.3% |
| Immigrants | Ecuador | 0.0 /100 | #314 | Tragic 6.4% |
| Pueblo | 0.0 /100 | #315 | Tragic 6.4% |
| Houma | 0.0 /100 | #316 | Tragic 6.4% |
| Immigrants | St. Vincent and the Grenadines | 0.0 /100 | #317 | Tragic 6.4% |
| British West Indians | 0.0 /100 | #318 | Tragic 6.4% |
| Immigrants | Bangladesh | 0.0 /100 | #319 | Tragic 6.5% |
| Immigrants | Dominica | 0.0 /100 | #320 | Tragic 6.5% |
| Blacks/African Americans | 0.0 /100 | #321 | Tragic 6.5% |
| Vietnamese | 0.0 /100 | #322 | Tragic 6.5% |
| Immigrants | Belize | 0.0 /100 | #323 | Tragic 6.5% |
| Cheyenne | 0.0 /100 | #324 | Tragic 6.6% |
| Apache | 0.0 /100 | #325 | Tragic 6.6% |
| Natives/Alaskans | 0.0 /100 | #326 | Tragic 6.6% |
| Alaska Natives | 0.0 /100 | #327 | Tragic 6.6% |