Immigrants from Liberia vs Immigrants from Dominica Female Unemployment
COMPARE
Immigrants from Liberia
Immigrants from Dominica
Female Unemployment
Female Unemployment Comparison
Immigrants from Liberia
Immigrants from Dominica
5.6%
FEMALE UNEMPLOYMENT
1.5/ 100
METRIC RATING
244th/ 347
METRIC RANK
6.5%
FEMALE UNEMPLOYMENT
0.0/ 100
METRIC RATING
320th/ 347
METRIC RANK
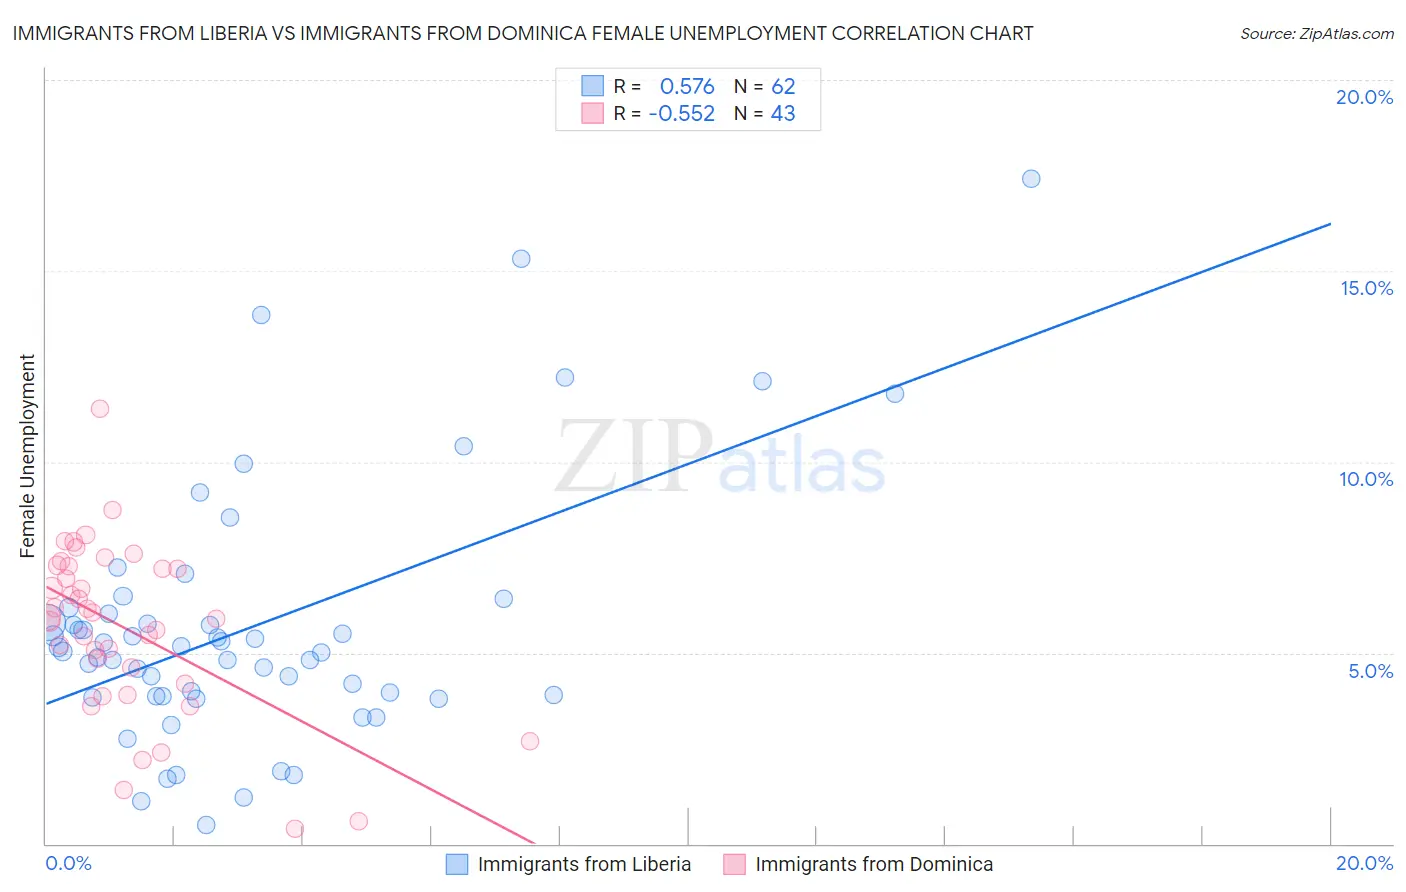
Immigrants from Liberia vs Immigrants from Dominica Female Unemployment Correlation Chart
The statistical analysis conducted on geographies consisting of 135,123,967 people shows a substantial positive correlation between the proportion of Immigrants from Liberia and unemploymnet rate among females in the United States with a correlation coefficient (R) of 0.576 and weighted average of 5.6%. Similarly, the statistical analysis conducted on geographies consisting of 83,755,488 people shows a substantial negative correlation between the proportion of Immigrants from Dominica and unemploymnet rate among females in the United States with a correlation coefficient (R) of -0.552 and weighted average of 6.5%, a difference of 15.6%.
Female Unemployment Correlation Summary
| Measurement | Immigrants from Liberia | Immigrants from Dominica |
| Minimum | 0.50% | 0.40% |
| Maximum | 17.4% | 11.4% |
| Range | 16.9% | 11.0% |
| Mean | 5.7% | 5.6% |
| Median | 5.1% | 5.9% |
| Interquartile 25% (IQ1) | 3.9% | 4.2% |
| Interquartile 75% (IQ3) | 6.0% | 7.3% |
| Interquartile Range (IQR) | 2.2% | 3.1% |
| Standard Deviation (Sample) | 3.3% | 2.2% |
| Standard Deviation (Population) | 3.3% | 2.2% |
Similar Demographics by Female Unemployment
Demographics Similar to Immigrants from Liberia by Female Unemployment
In terms of female unemployment, the demographic groups most similar to Immigrants from Liberia are Guamanian/Chamorro (5.6%, a difference of 0.14%), Japanese (5.6%, a difference of 0.37%), Immigrants from Western Asia (5.6%, a difference of 0.45%), Marshallese (5.6%, a difference of 0.55%), and Spanish American (5.6%, a difference of 0.55%).
| Demographics | Rating | Rank | Female Unemployment |
| Immigrants | Panama | 3.2 /100 | #237 | Tragic 5.5% |
| Sierra Leoneans | 3.2 /100 | #238 | Tragic 5.5% |
| Aleuts | 3.0 /100 | #239 | Tragic 5.5% |
| Immigrants | South America | 2.9 /100 | #240 | Tragic 5.5% |
| South American Indians | 2.8 /100 | #241 | Tragic 5.5% |
| Marshallese | 2.3 /100 | #242 | Tragic 5.6% |
| Spanish Americans | 2.2 /100 | #243 | Tragic 5.6% |
| Immigrants | Liberia | 1.5 /100 | #244 | Tragic 5.6% |
| Guamanians/Chamorros | 1.4 /100 | #245 | Tragic 5.6% |
| Japanese | 1.2 /100 | #246 | Tragic 5.6% |
| Immigrants | Western Asia | 1.1 /100 | #247 | Tragic 5.6% |
| Cree | 1.0 /100 | #248 | Tragic 5.6% |
| Immigrants | Uzbekistan | 1.0 /100 | #249 | Tragic 5.6% |
| Immigrants | Syria | 0.8 /100 | #250 | Tragic 5.6% |
| Assyrians/Chaldeans/Syriacs | 0.8 /100 | #251 | Tragic 5.6% |
Demographics Similar to Immigrants from Dominica by Female Unemployment
In terms of female unemployment, the demographic groups most similar to Immigrants from Dominica are Immigrants from Bangladesh (6.5%, a difference of 0.010%), British West Indian (6.4%, a difference of 0.20%), Immigrants from St. Vincent and the Grenadines (6.4%, a difference of 0.48%), Black/African American (6.5%, a difference of 0.54%), and Vietnamese (6.5%, a difference of 0.62%).
| Demographics | Rating | Rank | Female Unemployment |
| Belizeans | 0.0 /100 | #313 | Tragic 6.3% |
| Immigrants | Ecuador | 0.0 /100 | #314 | Tragic 6.4% |
| Pueblo | 0.0 /100 | #315 | Tragic 6.4% |
| Houma | 0.0 /100 | #316 | Tragic 6.4% |
| Immigrants | St. Vincent and the Grenadines | 0.0 /100 | #317 | Tragic 6.4% |
| British West Indians | 0.0 /100 | #318 | Tragic 6.4% |
| Immigrants | Bangladesh | 0.0 /100 | #319 | Tragic 6.5% |
| Immigrants | Dominica | 0.0 /100 | #320 | Tragic 6.5% |
| Blacks/African Americans | 0.0 /100 | #321 | Tragic 6.5% |
| Vietnamese | 0.0 /100 | #322 | Tragic 6.5% |
| Immigrants | Belize | 0.0 /100 | #323 | Tragic 6.5% |
| Cheyenne | 0.0 /100 | #324 | Tragic 6.6% |
| Apache | 0.0 /100 | #325 | Tragic 6.6% |
| Natives/Alaskans | 0.0 /100 | #326 | Tragic 6.6% |
| Alaska Natives | 0.0 /100 | #327 | Tragic 6.6% |