Turkish vs Immigrants from Dominica 6th Grade
COMPARE
Turkish
Immigrants from Dominica
6th Grade
6th Grade Comparison
Turks
Immigrants from Dominica
97.5%
6TH GRADE
98.3/ 100
METRIC RATING
100th/ 347
METRIC RANK
95.7%
6TH GRADE
0.0/ 100
METRIC RATING
300th/ 347
METRIC RANK
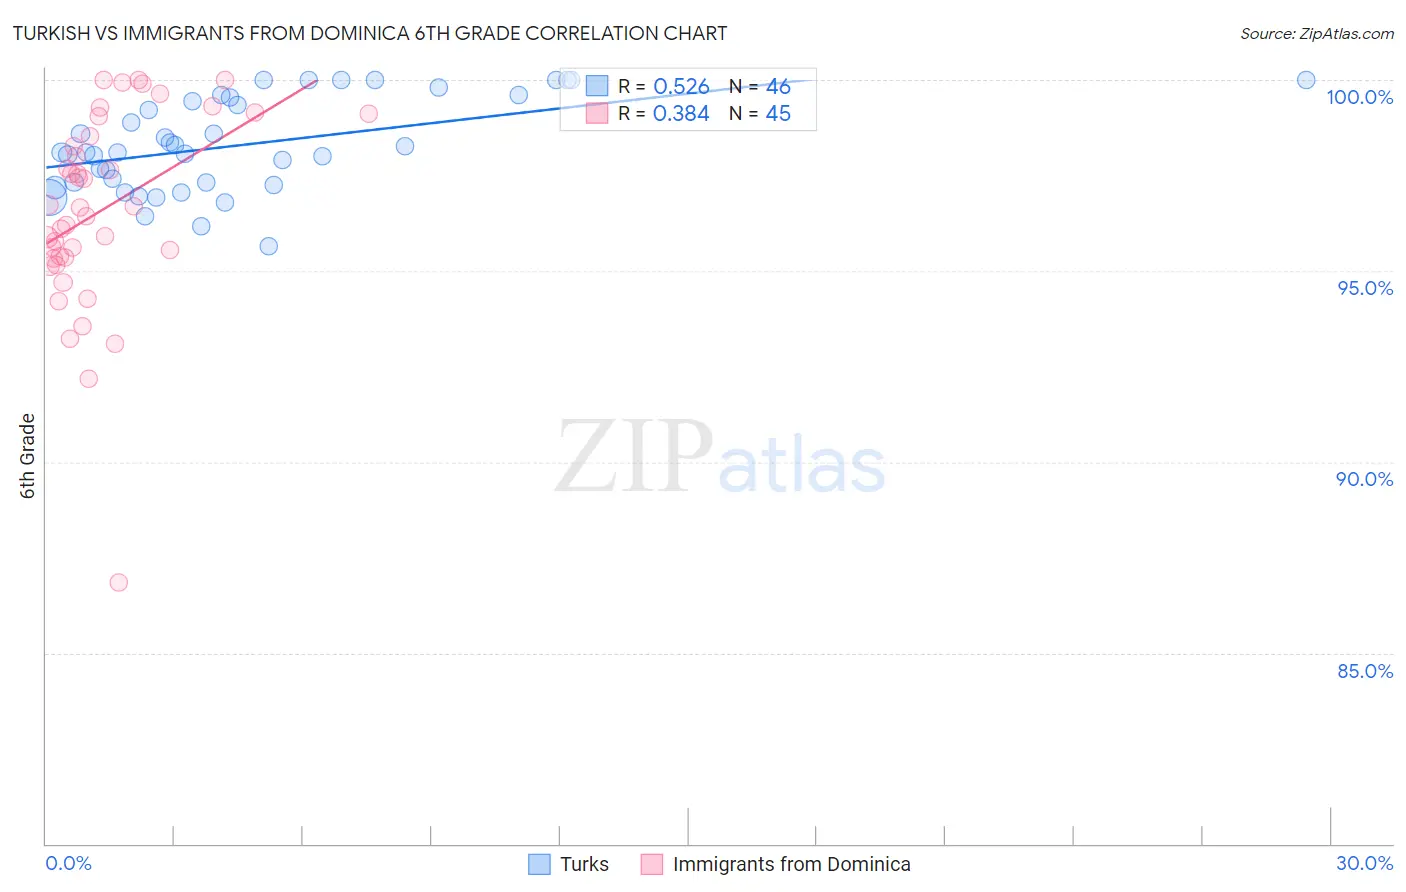
Turkish vs Immigrants from Dominica 6th Grade Correlation Chart
The statistical analysis conducted on geographies consisting of 271,858,657 people shows a substantial positive correlation between the proportion of Turks and percentage of population with at least 6th grade education in the United States with a correlation coefficient (R) of 0.526 and weighted average of 97.5%. Similarly, the statistical analysis conducted on geographies consisting of 83,794,115 people shows a mild positive correlation between the proportion of Immigrants from Dominica and percentage of population with at least 6th grade education in the United States with a correlation coefficient (R) of 0.384 and weighted average of 95.7%, a difference of 1.8%.
6th Grade Correlation Summary
| Measurement | Turkish | Immigrants from Dominica |
| Minimum | 95.6% | 86.8% |
| Maximum | 100.0% | 100.0% |
| Range | 4.4% | 13.2% |
| Mean | 98.3% | 96.6% |
| Median | 98.1% | 96.7% |
| Interquartile 25% (IQ1) | 97.3% | 95.3% |
| Interquartile 75% (IQ3) | 99.5% | 98.8% |
| Interquartile Range (IQR) | 2.2% | 3.5% |
| Standard Deviation (Sample) | 1.2% | 2.6% |
| Standard Deviation (Population) | 1.2% | 2.5% |
Similar Demographics by 6th Grade
Demographics Similar to Turks by 6th Grade
In terms of 6th grade, the demographic groups most similar to Turks are South African (97.5%, a difference of 0.0%), Immigrants from Denmark (97.5%, a difference of 0.020%), Yugoslavian (97.5%, a difference of 0.020%), Choctaw (97.5%, a difference of 0.020%), and Bhutanese (97.5%, a difference of 0.020%).
| Demographics | Rating | Rank | 6th Grade |
| Cree | 98.7 /100 | #93 | Exceptional 97.5% |
| Cypriots | 98.7 /100 | #94 | Exceptional 97.5% |
| Immigrants | Ireland | 98.7 /100 | #95 | Exceptional 97.5% |
| Immigrants | Germany | 98.6 /100 | #96 | Exceptional 97.5% |
| Immigrants | Sweden | 98.6 /100 | #97 | Exceptional 97.5% |
| Immigrants | Denmark | 98.5 /100 | #98 | Exceptional 97.5% |
| Yugoslavians | 98.5 /100 | #99 | Exceptional 97.5% |
| Turks | 98.3 /100 | #100 | Exceptional 97.5% |
| South Africans | 98.2 /100 | #101 | Exceptional 97.5% |
| Choctaw | 98.0 /100 | #102 | Exceptional 97.5% |
| Bhutanese | 98.0 /100 | #103 | Exceptional 97.5% |
| German Russians | 97.9 /100 | #104 | Exceptional 97.5% |
| Cheyenne | 97.9 /100 | #105 | Exceptional 97.5% |
| Menominee | 97.7 /100 | #106 | Exceptional 97.5% |
| Immigrants | Singapore | 97.6 /100 | #107 | Exceptional 97.5% |
Demographics Similar to Immigrants from Dominica by 6th Grade
In terms of 6th grade, the demographic groups most similar to Immigrants from Dominica are Immigrants from Laos (95.7%, a difference of 0.010%), Immigrants (95.7%, a difference of 0.010%), Immigrants from Burma/Myanmar (95.7%, a difference of 0.020%), Sri Lankan (95.8%, a difference of 0.030%), and Haitian (95.8%, a difference of 0.090%).
| Demographics | Rating | Rank | 6th Grade |
| Immigrants | West Indies | 0.0 /100 | #293 | Tragic 96.1% |
| British West Indians | 0.0 /100 | #294 | Tragic 96.0% |
| Immigrants | Grenada | 0.0 /100 | #295 | Tragic 95.9% |
| Immigrants | South Eastern Asia | 0.0 /100 | #296 | Tragic 95.9% |
| Haitians | 0.0 /100 | #297 | Tragic 95.8% |
| Sri Lankans | 0.0 /100 | #298 | Tragic 95.8% |
| Immigrants | Laos | 0.0 /100 | #299 | Tragic 95.7% |
| Immigrants | Dominica | 0.0 /100 | #300 | Tragic 95.7% |
| Immigrants | Immigrants | 0.0 /100 | #301 | Tragic 95.7% |
| Immigrants | Burma/Myanmar | 0.0 /100 | #302 | Tragic 95.7% |
| Bangladeshis | 0.0 /100 | #303 | Tragic 95.7% |
| Indonesians | 0.0 /100 | #304 | Tragic 95.6% |
| Immigrants | Cuba | 0.0 /100 | #305 | Tragic 95.6% |
| Immigrants | Haiti | 0.0 /100 | #306 | Tragic 95.6% |
| Guyanese | 0.0 /100 | #307 | Tragic 95.6% |