Turkish vs Asian Female Unemployment
COMPARE
Turkish
Asian
Female Unemployment
Female Unemployment Comparison
Turks
Asians
5.0%
FEMALE UNEMPLOYMENT
97.6/ 100
METRIC RATING
79th/ 347
METRIC RANK
5.2%
FEMALE UNEMPLOYMENT
78.3/ 100
METRIC RATING
149th/ 347
METRIC RANK
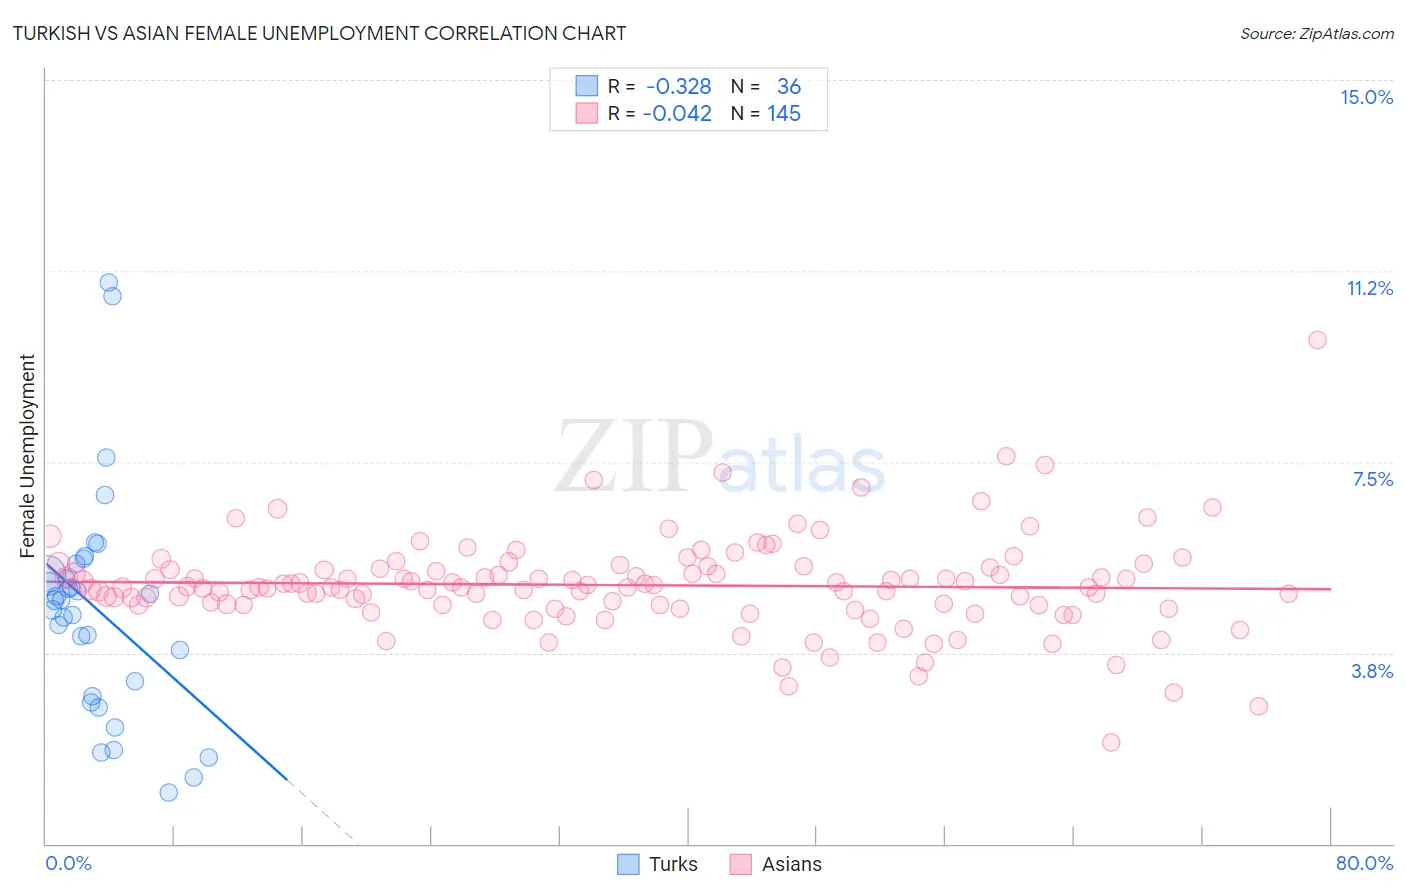
Turkish vs Asian Female Unemployment Correlation Chart
The statistical analysis conducted on geographies consisting of 271,277,320 people shows a mild negative correlation between the proportion of Turks and unemploymnet rate among females in the United States with a correlation coefficient (R) of -0.328 and weighted average of 5.0%. Similarly, the statistical analysis conducted on geographies consisting of 542,084,939 people shows no correlation between the proportion of Asians and unemploymnet rate among females in the United States with a correlation coefficient (R) of -0.042 and weighted average of 5.2%, a difference of 3.8%.
Female Unemployment Correlation Summary
| Measurement | Turkish | Asian |
| Minimum | 1.0% | 2.0% |
| Maximum | 11.0% | 9.9% |
| Range | 10.0% | 7.9% |
| Mean | 4.6% | 5.1% |
| Median | 4.8% | 5.0% |
| Interquartile 25% (IQ1) | 3.0% | 4.7% |
| Interquartile 75% (IQ3) | 5.4% | 5.4% |
| Interquartile Range (IQR) | 2.3% | 0.72% |
| Standard Deviation (Sample) | 2.2% | 0.94% |
| Standard Deviation (Population) | 2.2% | 0.94% |
Similar Demographics by Female Unemployment
Demographics Similar to Turks by Female Unemployment
In terms of female unemployment, the demographic groups most similar to Turks are New Zealander (5.0%, a difference of 0.12%), Filipino (5.0%, a difference of 0.14%), Immigrants from Netherlands (5.0%, a difference of 0.18%), Mongolian (5.0%, a difference of 0.19%), and Immigrants from Australia (5.0%, a difference of 0.19%).
| Demographics | Rating | Rank | Female Unemployment |
| Immigrants | Northern Europe | 98.0 /100 | #72 | Exceptional 4.9% |
| Russians | 98.0 /100 | #73 | Exceptional 5.0% |
| Immigrants | Bolivia | 98.0 /100 | #74 | Exceptional 5.0% |
| Immigrants | Singapore | 98.0 /100 | #75 | Exceptional 5.0% |
| Immigrants | Venezuela | 97.9 /100 | #76 | Exceptional 5.0% |
| Mongolians | 97.8 /100 | #77 | Exceptional 5.0% |
| Immigrants | Netherlands | 97.8 /100 | #78 | Exceptional 5.0% |
| Turks | 97.6 /100 | #79 | Exceptional 5.0% |
| New Zealanders | 97.4 /100 | #80 | Exceptional 5.0% |
| Filipinos | 97.3 /100 | #81 | Exceptional 5.0% |
| Immigrants | Australia | 97.3 /100 | #82 | Exceptional 5.0% |
| Immigrants | Serbia | 97.2 /100 | #83 | Exceptional 5.0% |
| Canadians | 97.2 /100 | #84 | Exceptional 5.0% |
| Ukrainians | 97.1 /100 | #85 | Exceptional 5.0% |
| Bolivians | 97.1 /100 | #86 | Exceptional 5.0% |
Demographics Similar to Asians by Female Unemployment
In terms of female unemployment, the demographic groups most similar to Asians are Egyptian (5.2%, a difference of 0.010%), Immigrants from Argentina (5.2%, a difference of 0.030%), Argentinean (5.2%, a difference of 0.080%), Immigrants from Norway (5.2%, a difference of 0.10%), and Immigrants from Oceania (5.2%, a difference of 0.11%).
| Demographics | Rating | Rank | Female Unemployment |
| Palestinians | 80.8 /100 | #142 | Excellent 5.1% |
| Immigrants | Kazakhstan | 80.7 /100 | #143 | Excellent 5.1% |
| Immigrants | Jordan | 80.4 /100 | #144 | Excellent 5.1% |
| Immigrants | Oceania | 79.5 /100 | #145 | Good 5.2% |
| Immigrants | Norway | 79.4 /100 | #146 | Good 5.2% |
| Argentineans | 79.2 /100 | #147 | Good 5.2% |
| Immigrants | Argentina | 78.7 /100 | #148 | Good 5.2% |
| Asians | 78.3 /100 | #149 | Good 5.2% |
| Egyptians | 78.3 /100 | #150 | Good 5.2% |
| Immigrants | China | 75.9 /100 | #151 | Good 5.2% |
| Immigrants | Italy | 75.0 /100 | #152 | Good 5.2% |
| Immigrants | Greece | 74.9 /100 | #153 | Good 5.2% |
| South Africans | 70.8 /100 | #154 | Good 5.2% |
| Immigrants | Egypt | 70.0 /100 | #155 | Good 5.2% |
| Immigrants | Northern Africa | 69.6 /100 | #156 | Good 5.2% |