Immigrants from Romania vs Immigrants from Dominica Female Unemployment
COMPARE
Immigrants from Romania
Immigrants from Dominica
Female Unemployment
Female Unemployment Comparison
Immigrants from Romania
Immigrants from Dominica
5.1%
FEMALE UNEMPLOYMENT
88.1/ 100
METRIC RATING
120th/ 347
METRIC RANK
6.5%
FEMALE UNEMPLOYMENT
0.0/ 100
METRIC RATING
320th/ 347
METRIC RANK
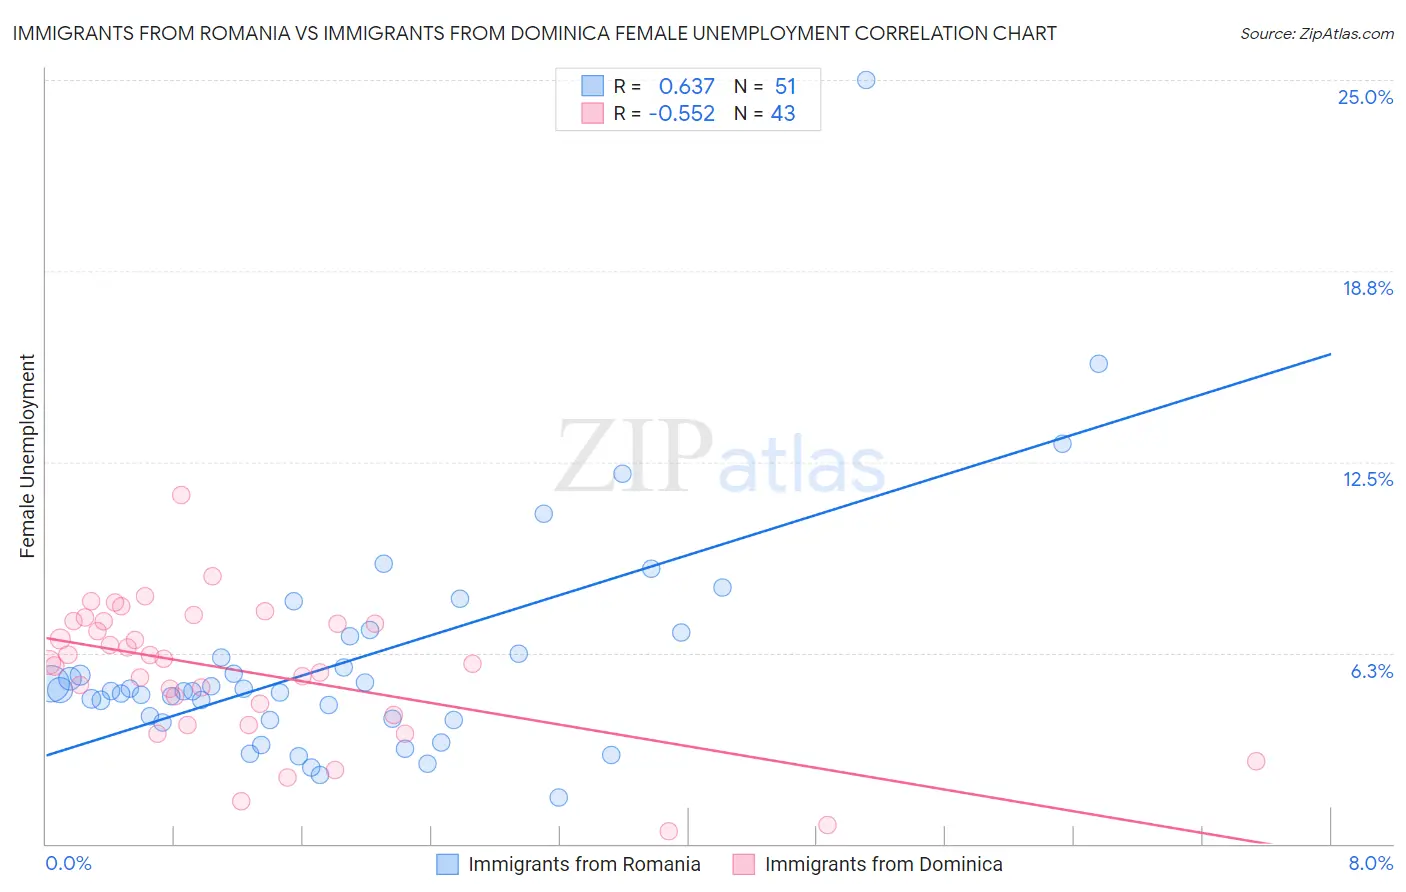
Immigrants from Romania vs Immigrants from Dominica Female Unemployment Correlation Chart
The statistical analysis conducted on geographies consisting of 256,484,740 people shows a significant positive correlation between the proportion of Immigrants from Romania and unemploymnet rate among females in the United States with a correlation coefficient (R) of 0.637 and weighted average of 5.1%. Similarly, the statistical analysis conducted on geographies consisting of 83,755,488 people shows a substantial negative correlation between the proportion of Immigrants from Dominica and unemploymnet rate among females in the United States with a correlation coefficient (R) of -0.552 and weighted average of 6.5%, a difference of 26.6%.
Female Unemployment Correlation Summary
| Measurement | Immigrants from Romania | Immigrants from Dominica |
| Minimum | 1.5% | 0.40% |
| Maximum | 25.0% | 11.4% |
| Range | 23.5% | 11.0% |
| Mean | 6.0% | 5.6% |
| Median | 5.0% | 5.9% |
| Interquartile 25% (IQ1) | 4.0% | 4.2% |
| Interquartile 75% (IQ3) | 6.8% | 7.3% |
| Interquartile Range (IQR) | 2.7% | 3.1% |
| Standard Deviation (Sample) | 3.9% | 2.2% |
| Standard Deviation (Population) | 3.8% | 2.2% |
Similar Demographics by Female Unemployment
Demographics Similar to Immigrants from Romania by Female Unemployment
In terms of female unemployment, the demographic groups most similar to Immigrants from Romania are Immigrants from Western Europe (5.1%, a difference of 0.0%), Immigrants from North Macedonia (5.1%, a difference of 0.020%), Immigrants from Germany (5.1%, a difference of 0.080%), Immigrants from South Africa (5.1%, a difference of 0.080%), and Immigrants from Europe (5.1%, a difference of 0.13%).
| Demographics | Rating | Rank | Female Unemployment |
| Immigrants | Saudi Arabia | 91.2 /100 | #113 | Exceptional 5.1% |
| Immigrants | Turkey | 91.0 /100 | #114 | Exceptional 5.1% |
| Lebanese | 91.0 /100 | #115 | Exceptional 5.1% |
| Americans | 90.5 /100 | #116 | Exceptional 5.1% |
| Jordanians | 90.3 /100 | #117 | Exceptional 5.1% |
| Immigrants | Croatia | 89.9 /100 | #118 | Excellent 5.1% |
| Immigrants | North Macedonia | 88.3 /100 | #119 | Excellent 5.1% |
| Immigrants | Romania | 88.1 /100 | #120 | Excellent 5.1% |
| Immigrants | Western Europe | 88.1 /100 | #121 | Excellent 5.1% |
| Immigrants | Germany | 87.6 /100 | #122 | Excellent 5.1% |
| Immigrants | South Africa | 87.6 /100 | #123 | Excellent 5.1% |
| Immigrants | Europe | 87.2 /100 | #124 | Excellent 5.1% |
| Basques | 86.5 /100 | #125 | Excellent 5.1% |
| Immigrants | Korea | 86.3 /100 | #126 | Excellent 5.1% |
| Immigrants | Hungary | 86.0 /100 | #127 | Excellent 5.1% |
Demographics Similar to Immigrants from Dominica by Female Unemployment
In terms of female unemployment, the demographic groups most similar to Immigrants from Dominica are Immigrants from Bangladesh (6.5%, a difference of 0.010%), British West Indian (6.4%, a difference of 0.20%), Immigrants from St. Vincent and the Grenadines (6.4%, a difference of 0.48%), Black/African American (6.5%, a difference of 0.54%), and Vietnamese (6.5%, a difference of 0.62%).
| Demographics | Rating | Rank | Female Unemployment |
| Belizeans | 0.0 /100 | #313 | Tragic 6.3% |
| Immigrants | Ecuador | 0.0 /100 | #314 | Tragic 6.4% |
| Pueblo | 0.0 /100 | #315 | Tragic 6.4% |
| Houma | 0.0 /100 | #316 | Tragic 6.4% |
| Immigrants | St. Vincent and the Grenadines | 0.0 /100 | #317 | Tragic 6.4% |
| British West Indians | 0.0 /100 | #318 | Tragic 6.4% |
| Immigrants | Bangladesh | 0.0 /100 | #319 | Tragic 6.5% |
| Immigrants | Dominica | 0.0 /100 | #320 | Tragic 6.5% |
| Blacks/African Americans | 0.0 /100 | #321 | Tragic 6.5% |
| Vietnamese | 0.0 /100 | #322 | Tragic 6.5% |
| Immigrants | Belize | 0.0 /100 | #323 | Tragic 6.5% |
| Cheyenne | 0.0 /100 | #324 | Tragic 6.6% |
| Apache | 0.0 /100 | #325 | Tragic 6.6% |
| Natives/Alaskans | 0.0 /100 | #326 | Tragic 6.6% |
| Alaska Natives | 0.0 /100 | #327 | Tragic 6.6% |