Lithuanian vs Carpatho Rusyn Unemployment Among Youth under 25 years
COMPARE
Lithuanian
Carpatho Rusyn
Unemployment Among Youth under 25 years
Unemployment Among Youth under 25 years Comparison
Lithuanians
Carpatho Rusyns
11.3%
UNEMPLOYMENT AMONG YOUTH UNDER 25 YEARS
94.8/ 100
METRIC RATING
94th/ 347
METRIC RANK
11.3%
UNEMPLOYMENT AMONG YOUTH UNDER 25 YEARS
94.4/ 100
METRIC RATING
95th/ 347
METRIC RANK
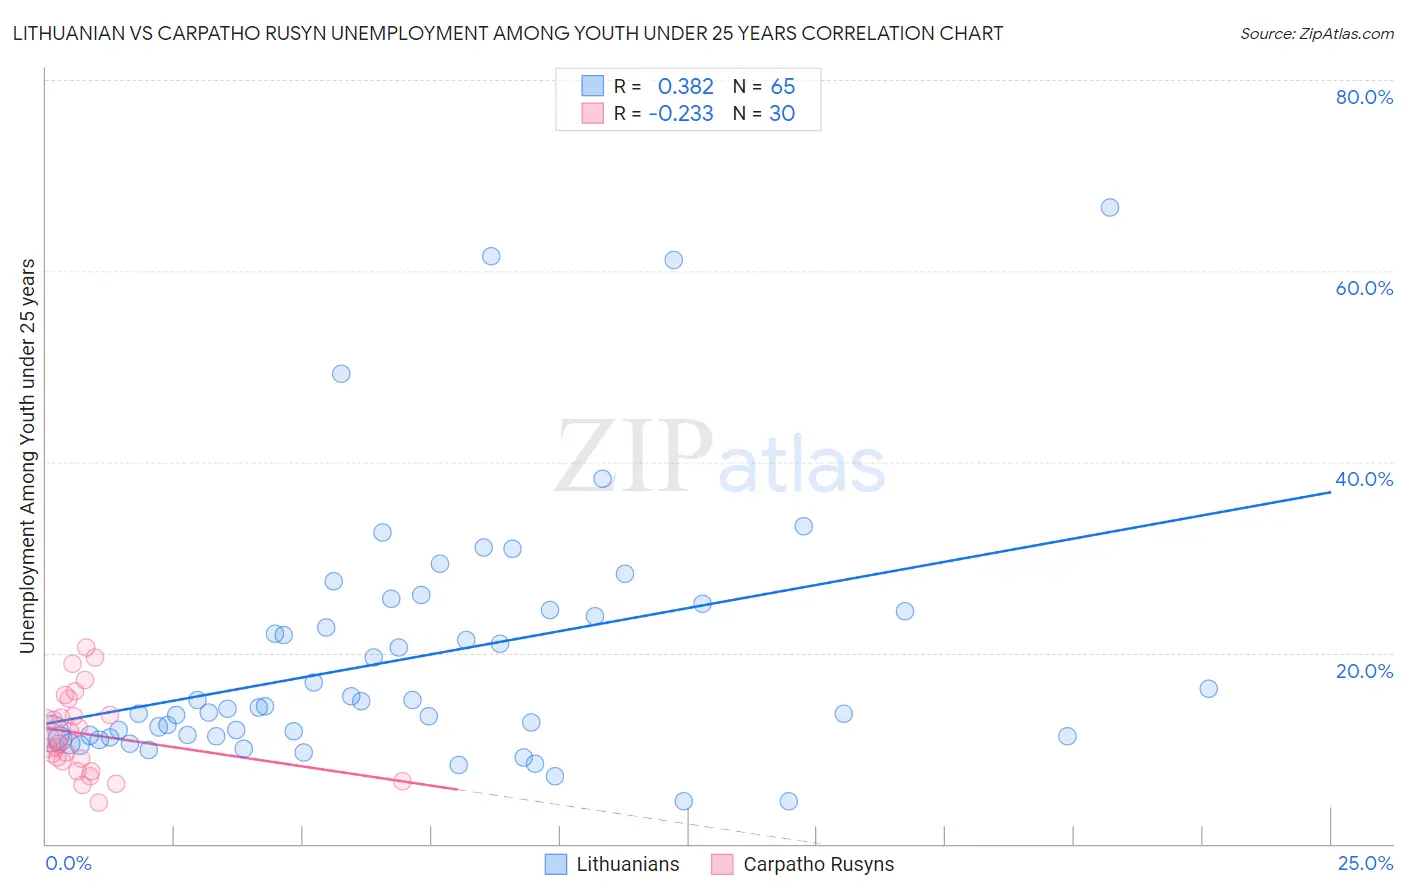
Lithuanian vs Carpatho Rusyn Unemployment Among Youth under 25 years Correlation Chart
The statistical analysis conducted on geographies consisting of 414,177,334 people shows a mild positive correlation between the proportion of Lithuanians and unemployment rate among youth under the age of 25 in the United States with a correlation coefficient (R) of 0.382 and weighted average of 11.3%. Similarly, the statistical analysis conducted on geographies consisting of 58,593,432 people shows a weak negative correlation between the proportion of Carpatho Rusyns and unemployment rate among youth under the age of 25 in the United States with a correlation coefficient (R) of -0.233 and weighted average of 11.3%, a difference of 0.070%.
Unemployment Among Youth under 25 years Correlation Summary
| Measurement | Lithuanian | Carpatho Rusyn |
| Minimum | 4.4% | 4.3% |
| Maximum | 66.6% | 20.6% |
| Range | 62.2% | 16.3% |
| Mean | 19.3% | 11.5% |
| Median | 14.3% | 10.7% |
| Interquartile 25% (IQ1) | 11.2% | 8.6% |
| Interquartile 75% (IQ3) | 24.4% | 13.5% |
| Interquartile Range (IQR) | 13.2% | 4.9% |
| Standard Deviation (Sample) | 13.0% | 4.2% |
| Standard Deviation (Population) | 12.9% | 4.1% |
Demographics Similar to Lithuanians and Carpatho Rusyns by Unemployment Among Youth under 25 years
In terms of unemployment among youth under 25 years, the demographic groups most similar to Lithuanians are Immigrants from Taiwan (11.2%, a difference of 0.070%), Immigrants from Latvia (11.2%, a difference of 0.070%), Immigrants from North America (11.2%, a difference of 0.070%), Immigrants from Serbia (11.3%, a difference of 0.090%), and Nicaraguan (11.3%, a difference of 0.11%). Similarly, the demographic groups most similar to Carpatho Rusyns are Immigrants from Serbia (11.3%, a difference of 0.010%), Nicaraguan (11.3%, a difference of 0.030%), Estonian (11.3%, a difference of 0.040%), Celtic (11.3%, a difference of 0.090%), and Pakistani (11.3%, a difference of 0.090%).
| Demographics | Rating | Rank | Unemployment Among Youth under 25 years |
| French Canadians | 95.9 /100 | #84 | Exceptional 11.2% |
| Immigrants | South Central Asia | 95.9 /100 | #85 | Exceptional 11.2% |
| Immigrants | South Africa | 95.8 /100 | #86 | Exceptional 11.2% |
| Kenyans | 95.7 /100 | #87 | Exceptional 11.2% |
| Austrians | 95.5 /100 | #88 | Exceptional 11.2% |
| Immigrants | Japan | 95.5 /100 | #89 | Exceptional 11.2% |
| Immigrants | Bolivia | 95.5 /100 | #90 | Exceptional 11.2% |
| Immigrants | Taiwan | 95.1 /100 | #91 | Exceptional 11.2% |
| Immigrants | Latvia | 95.1 /100 | #92 | Exceptional 11.2% |
| Immigrants | North America | 95.1 /100 | #93 | Exceptional 11.2% |
| Lithuanians | 94.8 /100 | #94 | Exceptional 11.3% |
| Carpatho Rusyns | 94.4 /100 | #95 | Exceptional 11.3% |
| Immigrants | Serbia | 94.4 /100 | #96 | Exceptional 11.3% |
| Nicaraguans | 94.3 /100 | #97 | Exceptional 11.3% |
| Estonians | 94.2 /100 | #98 | Exceptional 11.3% |
| Celtics | 94.0 /100 | #99 | Exceptional 11.3% |
| Pakistanis | 94.0 /100 | #100 | Exceptional 11.3% |
| Iroquois | 93.8 /100 | #101 | Exceptional 11.3% |
| Immigrants | Thailand | 93.6 /100 | #102 | Exceptional 11.3% |
| Immigrants | Malaysia | 93.6 /100 | #103 | Exceptional 11.3% |
| Immigrants | Afghanistan | 93.4 /100 | #104 | Exceptional 11.3% |