Immigrants from Ghana vs Carpatho Rusyn Unemployment Among Youth under 25 years
COMPARE
Immigrants from Ghana
Carpatho Rusyn
Unemployment Among Youth under 25 years
Unemployment Among Youth under 25 years Comparison
Immigrants from Ghana
Carpatho Rusyns
13.4%
UNEMPLOYMENT AMONG YOUTH UNDER 25 YEARS
0.0/ 100
METRIC RATING
289th/ 347
METRIC RANK
11.3%
UNEMPLOYMENT AMONG YOUTH UNDER 25 YEARS
94.4/ 100
METRIC RATING
95th/ 347
METRIC RANK
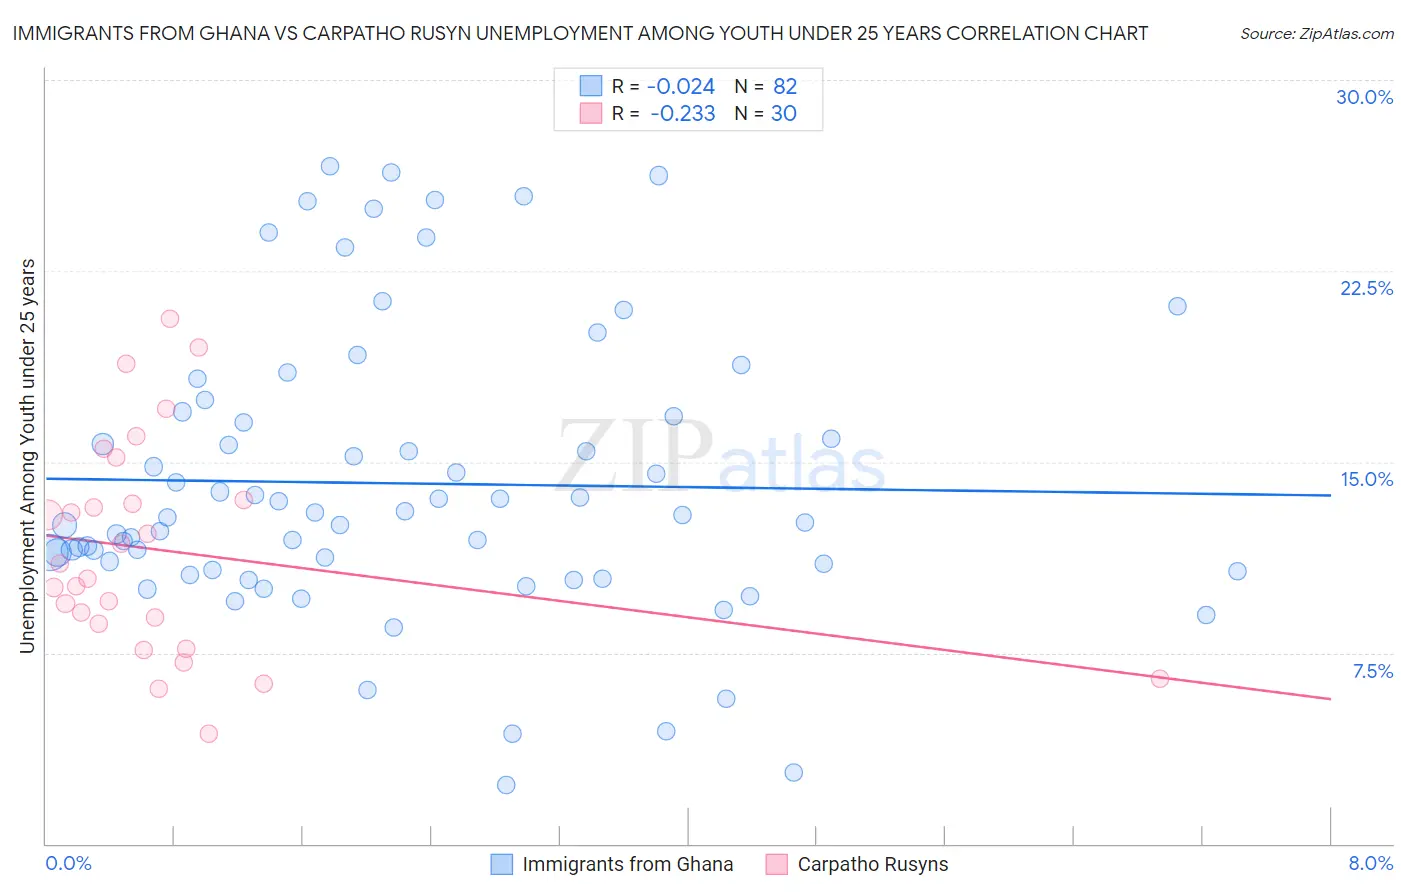
Immigrants from Ghana vs Carpatho Rusyn Unemployment Among Youth under 25 years Correlation Chart
The statistical analysis conducted on geographies consisting of 199,301,284 people shows no correlation between the proportion of Immigrants from Ghana and unemployment rate among youth under the age of 25 in the United States with a correlation coefficient (R) of -0.024 and weighted average of 13.4%. Similarly, the statistical analysis conducted on geographies consisting of 58,593,432 people shows a weak negative correlation between the proportion of Carpatho Rusyns and unemployment rate among youth under the age of 25 in the United States with a correlation coefficient (R) of -0.233 and weighted average of 11.3%, a difference of 18.7%.
Unemployment Among Youth under 25 years Correlation Summary
| Measurement | Immigrants from Ghana | Carpatho Rusyn |
| Minimum | 2.3% | 4.3% |
| Maximum | 26.6% | 20.6% |
| Range | 24.3% | 16.3% |
| Mean | 14.2% | 11.5% |
| Median | 12.9% | 10.7% |
| Interquartile 25% (IQ1) | 10.7% | 8.6% |
| Interquartile 75% (IQ3) | 16.8% | 13.5% |
| Interquartile Range (IQR) | 6.1% | 4.9% |
| Standard Deviation (Sample) | 5.6% | 4.2% |
| Standard Deviation (Population) | 5.5% | 4.1% |
Similar Demographics by Unemployment Among Youth under 25 years
Demographics Similar to Immigrants from Ghana by Unemployment Among Youth under 25 years
In terms of unemployment among youth under 25 years, the demographic groups most similar to Immigrants from Ghana are Immigrants from Western Africa (13.4%, a difference of 0.11%), Immigrants from Ecuador (13.4%, a difference of 0.34%), Ecuadorian (13.3%, a difference of 0.54%), Blackfeet (13.3%, a difference of 0.55%), and Ghanaian (13.3%, a difference of 0.60%).
| Demographics | Rating | Rank | Unemployment Among Youth under 25 years |
| Sierra Leoneans | 0.0 /100 | #282 | Tragic 13.3% |
| Immigrants | Cameroon | 0.0 /100 | #283 | Tragic 13.3% |
| Lumbee | 0.0 /100 | #284 | Tragic 13.3% |
| Ghanaians | 0.0 /100 | #285 | Tragic 13.3% |
| Blackfeet | 0.0 /100 | #286 | Tragic 13.3% |
| Ecuadorians | 0.0 /100 | #287 | Tragic 13.3% |
| Immigrants | Western Africa | 0.0 /100 | #288 | Tragic 13.4% |
| Immigrants | Ghana | 0.0 /100 | #289 | Tragic 13.4% |
| Immigrants | Ecuador | 0.0 /100 | #290 | Tragic 13.4% |
| Apache | 0.0 /100 | #291 | Tragic 13.5% |
| Central American Indians | 0.0 /100 | #292 | Tragic 13.5% |
| Spanish American Indians | 0.0 /100 | #293 | Tragic 13.5% |
| Immigrants | Caribbean | 0.0 /100 | #294 | Tragic 13.5% |
| Chippewa | 0.0 /100 | #295 | Tragic 13.5% |
| Senegalese | 0.0 /100 | #296 | Tragic 13.5% |
Demographics Similar to Carpatho Rusyns by Unemployment Among Youth under 25 years
In terms of unemployment among youth under 25 years, the demographic groups most similar to Carpatho Rusyns are Immigrants from Serbia (11.3%, a difference of 0.010%), Nicaraguan (11.3%, a difference of 0.030%), Estonian (11.3%, a difference of 0.040%), Lithuanian (11.3%, a difference of 0.070%), and Celtic (11.3%, a difference of 0.090%).
| Demographics | Rating | Rank | Unemployment Among Youth under 25 years |
| Austrians | 95.5 /100 | #88 | Exceptional 11.2% |
| Immigrants | Japan | 95.5 /100 | #89 | Exceptional 11.2% |
| Immigrants | Bolivia | 95.5 /100 | #90 | Exceptional 11.2% |
| Immigrants | Taiwan | 95.1 /100 | #91 | Exceptional 11.2% |
| Immigrants | Latvia | 95.1 /100 | #92 | Exceptional 11.2% |
| Immigrants | North America | 95.1 /100 | #93 | Exceptional 11.2% |
| Lithuanians | 94.8 /100 | #94 | Exceptional 11.3% |
| Carpatho Rusyns | 94.4 /100 | #95 | Exceptional 11.3% |
| Immigrants | Serbia | 94.4 /100 | #96 | Exceptional 11.3% |
| Nicaraguans | 94.3 /100 | #97 | Exceptional 11.3% |
| Estonians | 94.2 /100 | #98 | Exceptional 11.3% |
| Celtics | 94.0 /100 | #99 | Exceptional 11.3% |
| Pakistanis | 94.0 /100 | #100 | Exceptional 11.3% |
| Iroquois | 93.8 /100 | #101 | Exceptional 11.3% |
| Immigrants | Thailand | 93.6 /100 | #102 | Exceptional 11.3% |