Trinidadian and Tobagonian vs Immigrants from Brazil Unemployment Among Women with Children Ages 6 to 17 years
COMPARE
Trinidadian and Tobagonian
Immigrants from Brazil
Unemployment Among Women with Children Ages 6 to 17 years
Unemployment Among Women with Children Ages 6 to 17 years Comparison
Trinidadians and Tobagonians
Immigrants from Brazil
9.1%
UNEMPLOYMENT AMONG WOMEN WITH CHILDREN AGES 6 TO 17 YEARS
18.2/ 100
METRIC RATING
200th/ 347
METRIC RANK
9.0%
UNEMPLOYMENT AMONG WOMEN WITH CHILDREN AGES 6 TO 17 YEARS
51.0/ 100
METRIC RATING
173rd/ 347
METRIC RANK
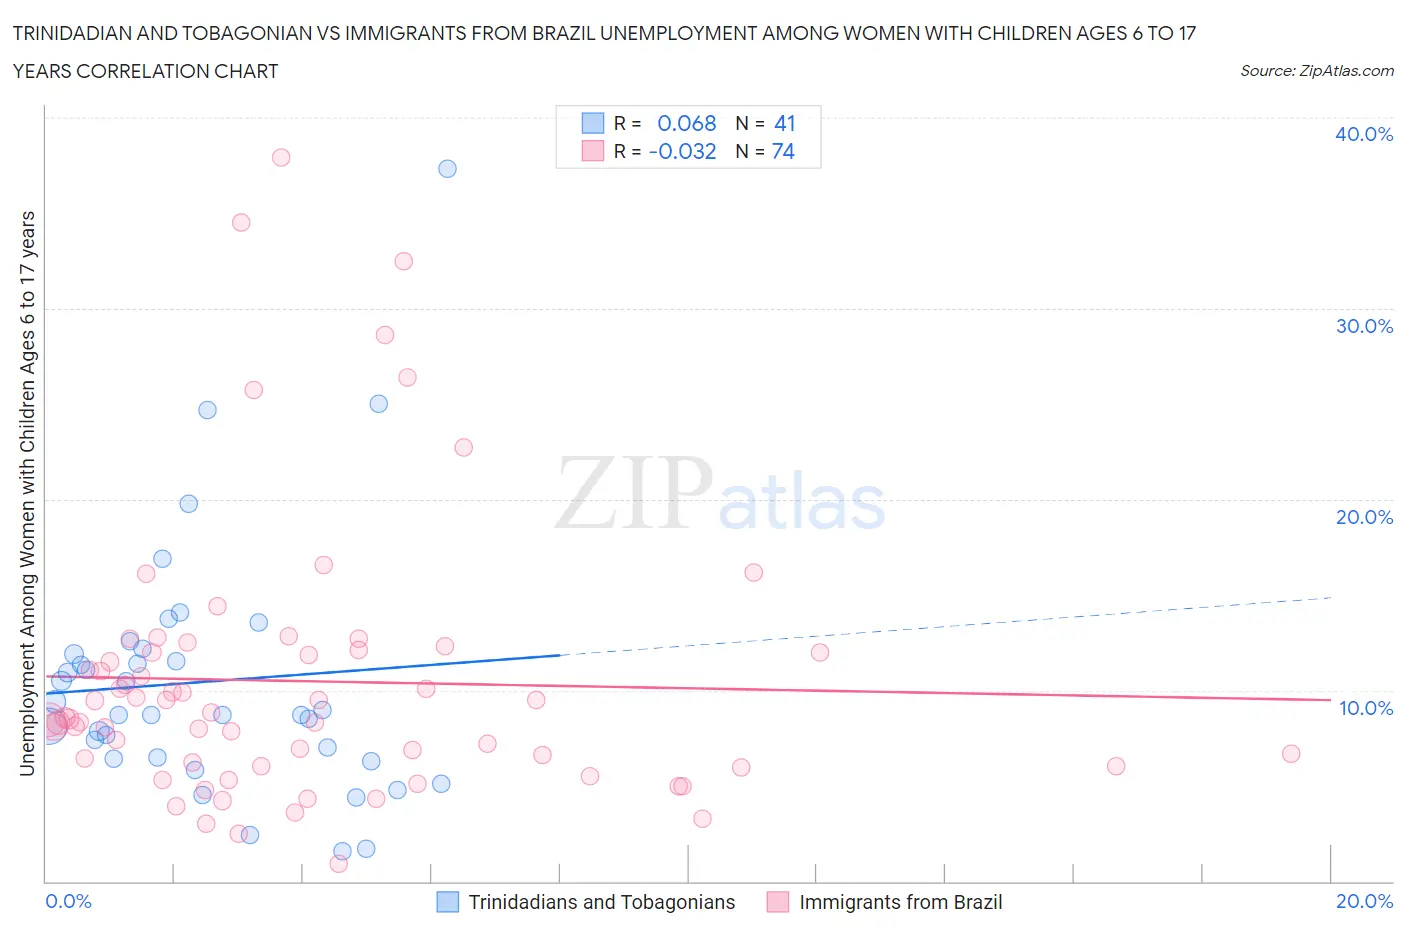
Trinidadian and Tobagonian vs Immigrants from Brazil Unemployment Among Women with Children Ages 6 to 17 years Correlation Chart
The statistical analysis conducted on geographies consisting of 177,682,071 people shows a slight positive correlation between the proportion of Trinidadians and Tobagonians and unemployment rate among women with children between the ages 6 and 17 in the United States with a correlation coefficient (R) of 0.068 and weighted average of 9.1%. Similarly, the statistical analysis conducted on geographies consisting of 251,390,083 people shows no correlation between the proportion of Immigrants from Brazil and unemployment rate among women with children between the ages 6 and 17 in the United States with a correlation coefficient (R) of -0.032 and weighted average of 9.0%, a difference of 1.7%.
Unemployment Among Women with Children Ages 6 to 17 years Correlation Summary
| Measurement | Trinidadian and Tobagonian | Immigrants from Brazil |
| Minimum | 1.6% | 0.90% |
| Maximum | 37.3% | 37.9% |
| Range | 35.7% | 37.0% |
| Mean | 10.4% | 10.5% |
| Median | 8.7% | 8.5% |
| Interquartile 25% (IQ1) | 6.4% | 6.1% |
| Interquartile 75% (IQ3) | 12.0% | 12.0% |
| Interquartile Range (IQR) | 5.6% | 5.9% |
| Standard Deviation (Sample) | 6.7% | 7.2% |
| Standard Deviation (Population) | 6.6% | 7.2% |
Similar Demographics by Unemployment Among Women with Children Ages 6 to 17 years
Demographics Similar to Trinidadians and Tobagonians by Unemployment Among Women with Children Ages 6 to 17 years
In terms of unemployment among women with children ages 6 to 17 years, the demographic groups most similar to Trinidadians and Tobagonians are Immigrants from Trinidad and Tobago (9.1%, a difference of 0.11%), Czechoslovakian (9.1%, a difference of 0.18%), Immigrants from Middle Africa (9.1%, a difference of 0.20%), Maltese (9.1%, a difference of 0.22%), and Immigrants from Canada (9.1%, a difference of 0.23%).
| Demographics | Rating | Rank | Unemployment Among Women with Children Ages 6 to 17 years |
| Immigrants | Turkey | 25.8 /100 | #193 | Fair 9.1% |
| Immigrants | Kazakhstan | 25.3 /100 | #194 | Fair 9.1% |
| Austrians | 25.0 /100 | #195 | Fair 9.1% |
| Brazilians | 24.4 /100 | #196 | Fair 9.1% |
| Immigrants | Panama | 24.3 /100 | #197 | Fair 9.1% |
| Guyanese | 21.8 /100 | #198 | Fair 9.1% |
| Czechoslovakians | 20.8 /100 | #199 | Fair 9.1% |
| Trinidadians and Tobagonians | 18.2 /100 | #200 | Poor 9.1% |
| Immigrants | Trinidad and Tobago | 16.7 /100 | #201 | Poor 9.1% |
| Immigrants | Middle Africa | 15.6 /100 | #202 | Poor 9.1% |
| Maltese | 15.3 /100 | #203 | Poor 9.1% |
| Immigrants | Canada | 15.3 /100 | #204 | Poor 9.1% |
| Immigrants | Western Europe | 14.1 /100 | #205 | Poor 9.1% |
| Immigrants | North America | 12.7 /100 | #206 | Poor 9.2% |
| Cubans | 10.9 /100 | #207 | Poor 9.2% |
Demographics Similar to Immigrants from Brazil by Unemployment Among Women with Children Ages 6 to 17 years
In terms of unemployment among women with children ages 6 to 17 years, the demographic groups most similar to Immigrants from Brazil are Jordanian (9.0%, a difference of 0.050%), Immigrants from West Indies (9.0%, a difference of 0.050%), Immigrants from Costa Rica (9.0%, a difference of 0.050%), Turkish (8.9%, a difference of 0.14%), and British (8.9%, a difference of 0.19%).
| Demographics | Rating | Rank | Unemployment Among Women with Children Ages 6 to 17 years |
| Moroccans | 58.3 /100 | #166 | Average 8.9% |
| Immigrants | England | 57.7 /100 | #167 | Average 8.9% |
| Immigrants | Croatia | 57.1 /100 | #168 | Average 8.9% |
| British | 55.2 /100 | #169 | Average 8.9% |
| Turks | 54.1 /100 | #170 | Average 8.9% |
| Jordanians | 52.2 /100 | #171 | Average 9.0% |
| Immigrants | West Indies | 52.2 /100 | #172 | Average 9.0% |
| Immigrants | Brazil | 51.0 /100 | #173 | Average 9.0% |
| Immigrants | Costa Rica | 50.0 /100 | #174 | Average 9.0% |
| Immigrants | Sierra Leone | 45.9 /100 | #175 | Average 9.0% |
| Immigrants | Italy | 43.7 /100 | #176 | Average 9.0% |
| Immigrants | Jordan | 41.6 /100 | #177 | Average 9.0% |
| Menominee | 39.3 /100 | #178 | Fair 9.0% |
| Immigrants | Zaire | 38.3 /100 | #179 | Fair 9.0% |
| Ethiopians | 37.6 /100 | #180 | Fair 9.0% |