Samoan vs Immigrants from Oceania Unemployment Among Ages 20 to 24 years
COMPARE
Samoan
Immigrants from Oceania
Unemployment Among Ages 20 to 24 years
Unemployment Among Ages 20 to 24 years Comparison
Samoans
Immigrants from Oceania
10.3%
UNEMPLOYMENT AMONG AGES 20 TO 24 YEARS
45.4/ 100
METRIC RATING
175th/ 347
METRIC RANK
10.0%
UNEMPLOYMENT AMONG AGES 20 TO 24 YEARS
97.4/ 100
METRIC RATING
87th/ 347
METRIC RANK
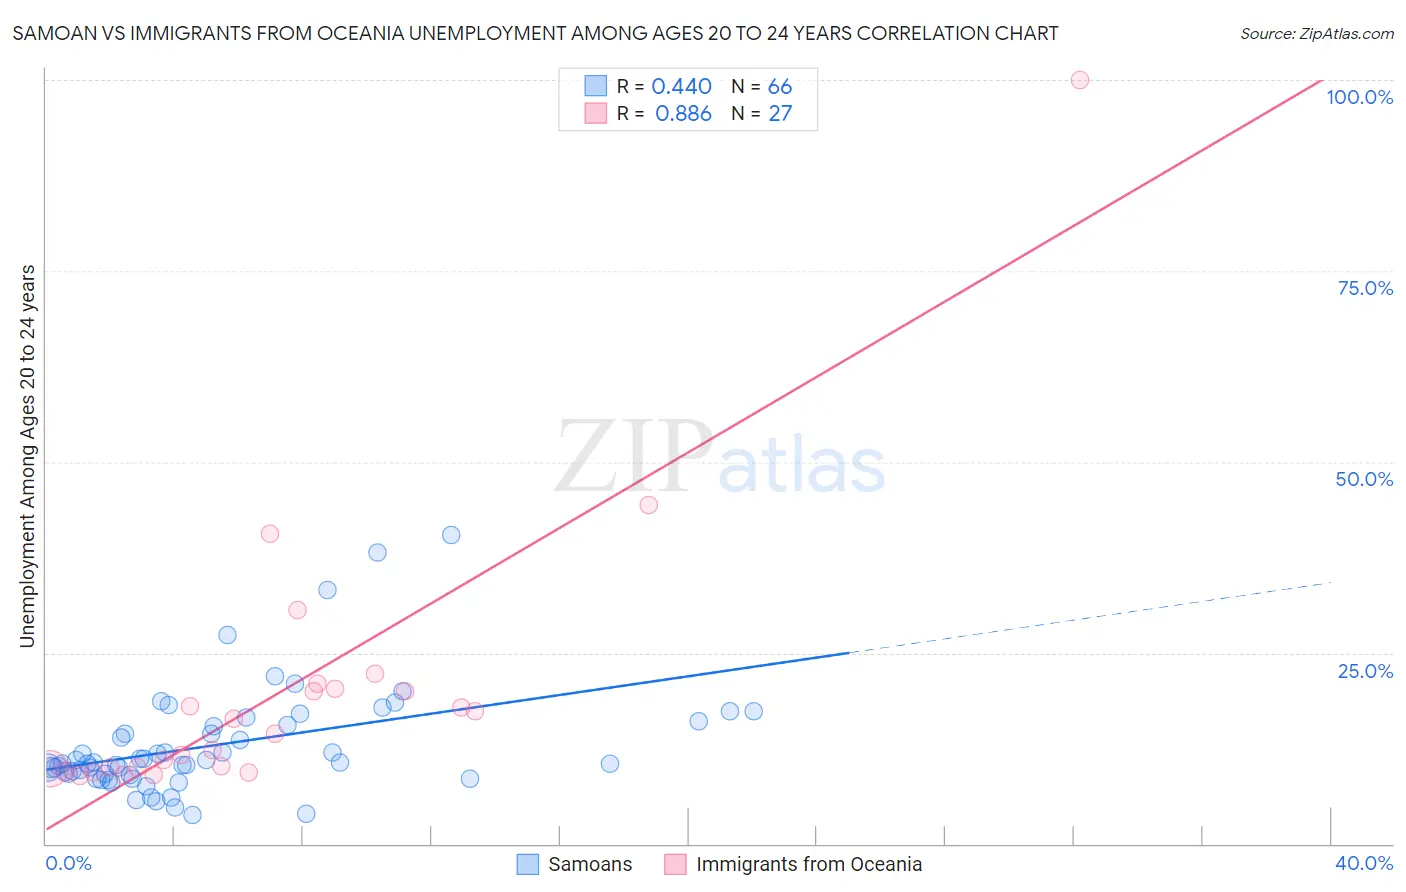
Samoan vs Immigrants from Oceania Unemployment Among Ages 20 to 24 years Correlation Chart
The statistical analysis conducted on geographies consisting of 221,635,604 people shows a moderate positive correlation between the proportion of Samoans and unemployment rate among population between the ages 20 and 24 in the United States with a correlation coefficient (R) of 0.440 and weighted average of 10.3%. Similarly, the statistical analysis conducted on geographies consisting of 298,383,389 people shows a very strong positive correlation between the proportion of Immigrants from Oceania and unemployment rate among population between the ages 20 and 24 in the United States with a correlation coefficient (R) of 0.886 and weighted average of 10.0%, a difference of 3.6%.
Unemployment Among Ages 20 to 24 years Correlation Summary
| Measurement | Samoan | Immigrants from Oceania |
| Minimum | 3.8% | 9.0% |
| Maximum | 40.4% | 100.0% |
| Range | 36.6% | 91.0% |
| Mean | 12.9% | 19.7% |
| Median | 10.6% | 14.4% |
| Interquartile 25% (IQ1) | 9.2% | 9.8% |
| Interquartile 75% (IQ3) | 15.5% | 20.3% |
| Interquartile Range (IQR) | 6.3% | 10.5% |
| Standard Deviation (Sample) | 7.0% | 18.5% |
| Standard Deviation (Population) | 7.0% | 18.2% |
Similar Demographics by Unemployment Among Ages 20 to 24 years
Demographics Similar to Samoans by Unemployment Among Ages 20 to 24 years
In terms of unemployment among ages 20 to 24 years, the demographic groups most similar to Samoans are Potawatomi (10.3%, a difference of 0.13%), Ukrainian (10.3%, a difference of 0.17%), Immigrants from Czechoslovakia (10.3%, a difference of 0.17%), Alsatian (10.3%, a difference of 0.19%), and Immigrants from Sweden (10.3%, a difference of 0.20%).
| Demographics | Rating | Rank | Unemployment Among Ages 20 to 24 years |
| Iraqis | 56.7 /100 | #168 | Average 10.3% |
| Immigrants | Colombia | 56.3 /100 | #169 | Average 10.3% |
| Turks | 55.2 /100 | #170 | Average 10.3% |
| Immigrants | Eastern Asia | 52.7 /100 | #171 | Average 10.3% |
| Koreans | 51.9 /100 | #172 | Average 10.3% |
| Immigrants | Sweden | 50.8 /100 | #173 | Average 10.3% |
| Ukrainians | 50.0 /100 | #174 | Average 10.3% |
| Samoans | 45.4 /100 | #175 | Average 10.3% |
| Potawatomi | 42.0 /100 | #176 | Average 10.3% |
| Immigrants | Czechoslovakia | 40.8 /100 | #177 | Average 10.3% |
| Alsatians | 40.5 /100 | #178 | Average 10.3% |
| Tlingit-Haida | 39.7 /100 | #179 | Fair 10.3% |
| Immigrants | Turkey | 39.3 /100 | #180 | Fair 10.3% |
| Okinawans | 39.1 /100 | #181 | Fair 10.3% |
| Immigrants | Germany | 38.1 /100 | #182 | Fair 10.4% |
Demographics Similar to Immigrants from Oceania by Unemployment Among Ages 20 to 24 years
In terms of unemployment among ages 20 to 24 years, the demographic groups most similar to Immigrants from Oceania are Immigrants from Vietnam (10.0%, a difference of 0.040%), Polish (10.0%, a difference of 0.090%), Macedonian (10.0%, a difference of 0.11%), Chilean (10.0%, a difference of 0.11%), and Bhutanese (10.0%, a difference of 0.14%).
| Demographics | Rating | Rank | Unemployment Among Ages 20 to 24 years |
| Immigrants | Netherlands | 98.2 /100 | #80 | Exceptional 9.9% |
| Yaqui | 98.0 /100 | #81 | Exceptional 9.9% |
| Sri Lankans | 98.0 /100 | #82 | Exceptional 9.9% |
| Immigrants | Bulgaria | 98.0 /100 | #83 | Exceptional 9.9% |
| Latvians | 97.9 /100 | #84 | Exceptional 9.9% |
| New Zealanders | 97.8 /100 | #85 | Exceptional 9.9% |
| Immigrants | Vietnam | 97.5 /100 | #86 | Exceptional 10.0% |
| Immigrants | Oceania | 97.4 /100 | #87 | Exceptional 10.0% |
| Poles | 97.1 /100 | #88 | Exceptional 10.0% |
| Macedonians | 97.0 /100 | #89 | Exceptional 10.0% |
| Chileans | 97.0 /100 | #90 | Exceptional 10.0% |
| Bhutanese | 96.9 /100 | #91 | Exceptional 10.0% |
| Bangladeshis | 96.9 /100 | #92 | Exceptional 10.0% |
| Immigrants | Malaysia | 96.9 /100 | #93 | Exceptional 10.0% |
| Immigrants | Micronesia | 96.6 /100 | #94 | Exceptional 10.0% |