Guyanese vs Pima Unemployment Among Ages 45 to 54 years
COMPARE
Guyanese
Pima
Unemployment Among Ages 45 to 54 years
Unemployment Among Ages 45 to 54 years Comparison
Guyanese
Pima
5.6%
UNEMPLOYMENT AMONG AGES 45 TO 54 YEARS
0.0/ 100
METRIC RATING
314th/ 347
METRIC RANK
6.4%
UNEMPLOYMENT AMONG AGES 45 TO 54 YEARS
0.0/ 100
METRIC RATING
332nd/ 347
METRIC RANK
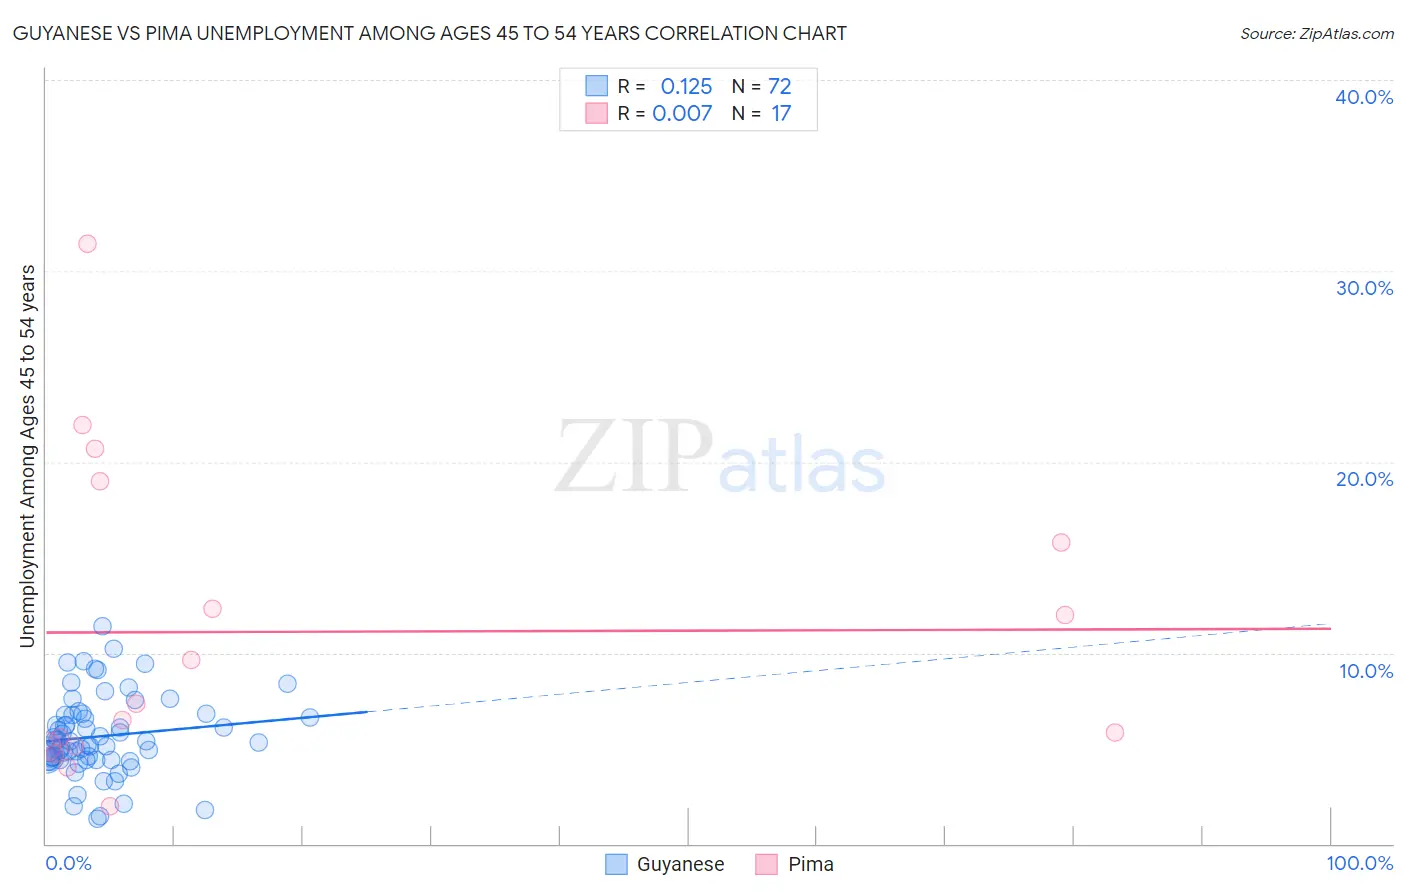
Guyanese vs Pima Unemployment Among Ages 45 to 54 years Correlation Chart
The statistical analysis conducted on geographies consisting of 175,185,002 people shows a poor positive correlation between the proportion of Guyanese and unemployment rate among population between the ages 45 and 54 in the United States with a correlation coefficient (R) of 0.125 and weighted average of 5.6%. Similarly, the statistical analysis conducted on geographies consisting of 61,232,802 people shows no correlation between the proportion of Pima and unemployment rate among population between the ages 45 and 54 in the United States with a correlation coefficient (R) of 0.007 and weighted average of 6.4%, a difference of 14.9%.
Unemployment Among Ages 45 to 54 years Correlation Summary
| Measurement | Guyanese | Pima |
| Minimum | 1.3% | 2.0% |
| Maximum | 11.4% | 31.4% |
| Range | 10.1% | 29.5% |
| Mean | 5.6% | 11.1% |
| Median | 5.3% | 7.3% |
| Interquartile 25% (IQ1) | 4.4% | 5.1% |
| Interquartile 75% (IQ3) | 6.7% | 17.4% |
| Interquartile Range (IQR) | 2.3% | 12.3% |
| Standard Deviation (Sample) | 2.1% | 8.1% |
| Standard Deviation (Population) | 2.1% | 7.9% |
Demographics Similar to Guyanese and Pima by Unemployment Among Ages 45 to 54 years
In terms of unemployment among ages 45 to 54 years, the demographic groups most similar to Guyanese are Immigrants from Dominica (5.6%, a difference of 0.18%), Shoshone (5.6%, a difference of 0.33%), Immigrants from Guyana (5.6%, a difference of 0.38%), Houma (5.6%, a difference of 0.48%), and British West Indian (5.7%, a difference of 1.1%). Similarly, the demographic groups most similar to Pima are Immigrants from Yemen (6.5%, a difference of 1.7%), Tohono O'odham (6.3%, a difference of 2.7%), Immigrants from Dominican Republic (6.3%, a difference of 2.8%), Alaska Native (6.3%, a difference of 2.9%), and Pueblo (6.2%, a difference of 3.6%).
| Demographics | Rating | Rank | Unemployment Among Ages 45 to 54 years |
| Shoshone | 0.0 /100 | #313 | Tragic 5.6% |
| Guyanese | 0.0 /100 | #314 | Tragic 5.6% |
| Immigrants | Dominica | 0.0 /100 | #315 | Tragic 5.6% |
| Immigrants | Guyana | 0.0 /100 | #316 | Tragic 5.6% |
| Houma | 0.0 /100 | #317 | Tragic 5.6% |
| British West Indians | 0.0 /100 | #318 | Tragic 5.7% |
| Cape Verdeans | 0.0 /100 | #319 | Tragic 5.7% |
| Immigrants | St. Vincent and the Grenadines | 0.0 /100 | #320 | Tragic 5.7% |
| Yakama | 0.0 /100 | #321 | Tragic 5.7% |
| Immigrants | Azores | 0.0 /100 | #322 | Tragic 5.7% |
| Immigrants | Cabo Verde | 0.0 /100 | #323 | Tragic 5.9% |
| Natives/Alaskans | 0.0 /100 | #324 | Tragic 6.1% |
| Immigrants | Armenia | 0.0 /100 | #325 | Tragic 6.1% |
| Ute | 0.0 /100 | #326 | Tragic 6.2% |
| Dominicans | 0.0 /100 | #327 | Tragic 6.2% |
| Pueblo | 0.0 /100 | #328 | Tragic 6.2% |
| Alaska Natives | 0.0 /100 | #329 | Tragic 6.3% |
| Immigrants | Dominican Republic | 0.0 /100 | #330 | Tragic 6.3% |
| Tohono O'odham | 0.0 /100 | #331 | Tragic 6.3% |
| Pima | 0.0 /100 | #332 | Tragic 6.4% |
| Immigrants | Yemen | 0.0 /100 | #333 | Tragic 6.5% |