Tlingit-Haida vs Immigrants from Latin America Unemployment Among Ages 20 to 24 years
COMPARE
Tlingit-Haida
Immigrants from Latin America
Unemployment Among Ages 20 to 24 years
Unemployment Among Ages 20 to 24 years Comparison
Tlingit-Haida
Immigrants from Latin America
10.3%
UNEMPLOYMENT AMONG AGES 20 TO 24 YEARS
39.7/ 100
METRIC RATING
179th/ 347
METRIC RANK
11.0%
UNEMPLOYMENT AMONG AGES 20 TO 24 YEARS
0.1/ 100
METRIC RATING
262nd/ 347
METRIC RANK
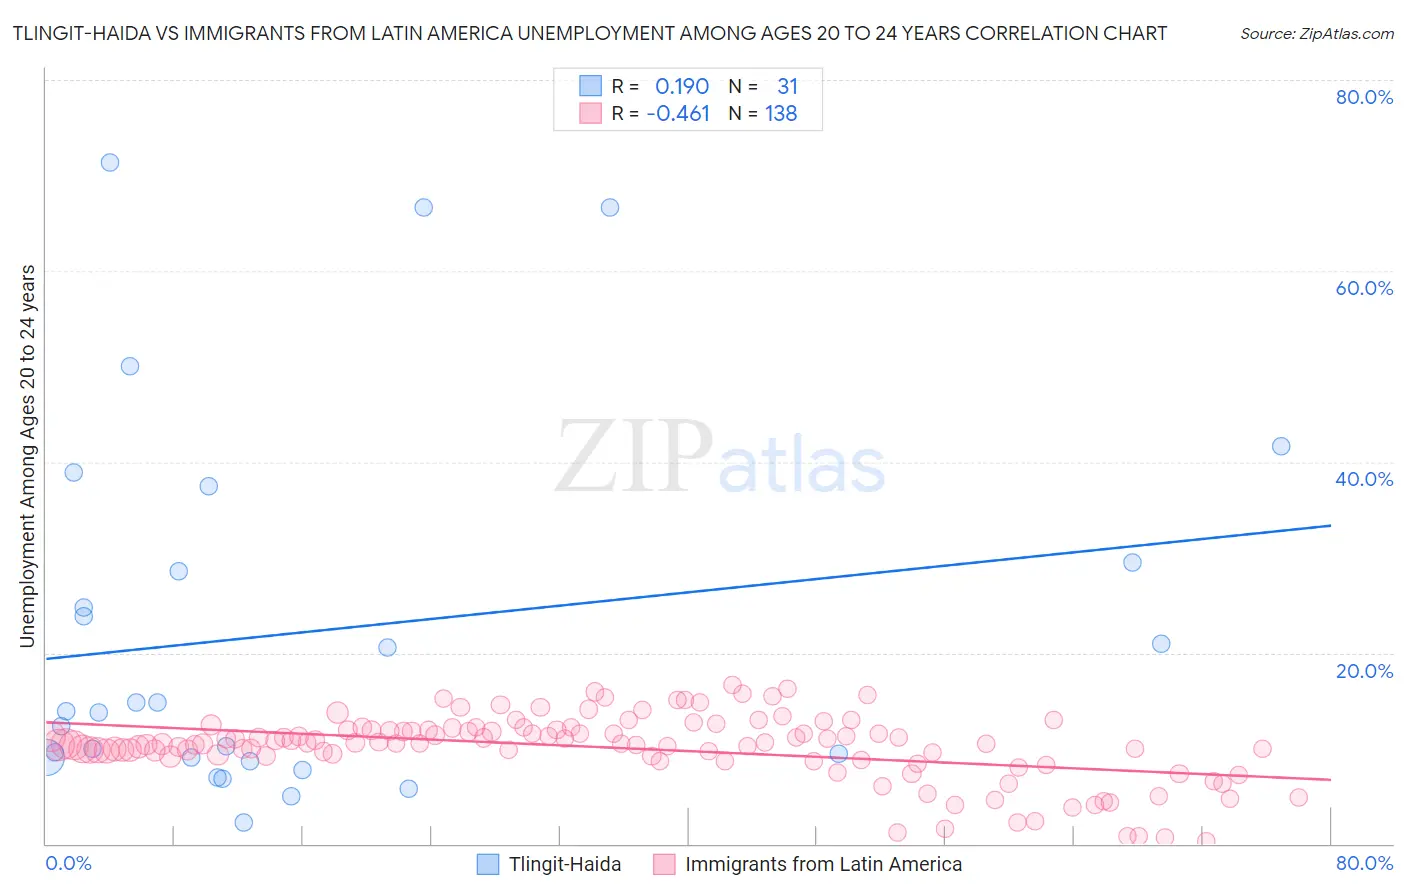
Tlingit-Haida vs Immigrants from Latin America Unemployment Among Ages 20 to 24 years Correlation Chart
The statistical analysis conducted on geographies consisting of 60,175,372 people shows a poor positive correlation between the proportion of Tlingit-Haida and unemployment rate among population between the ages 20 and 24 in the United States with a correlation coefficient (R) of 0.190 and weighted average of 10.3%. Similarly, the statistical analysis conducted on geographies consisting of 518,664,657 people shows a moderate negative correlation between the proportion of Immigrants from Latin America and unemployment rate among population between the ages 20 and 24 in the United States with a correlation coefficient (R) of -0.461 and weighted average of 11.0%, a difference of 5.9%.
Unemployment Among Ages 20 to 24 years Correlation Summary
| Measurement | Tlingit-Haida | Immigrants from Latin America |
| Minimum | 2.2% | 0.20% |
| Maximum | 71.4% | 16.6% |
| Range | 69.2% | 16.4% |
| Mean | 22.3% | 10.1% |
| Median | 13.9% | 10.5% |
| Interquartile 25% (IQ1) | 9.0% | 9.2% |
| Interquartile 75% (IQ3) | 29.4% | 11.9% |
| Interquartile Range (IQR) | 20.4% | 2.7% |
| Standard Deviation (Sample) | 19.4% | 3.5% |
| Standard Deviation (Population) | 19.1% | 3.5% |
Similar Demographics by Unemployment Among Ages 20 to 24 years
Demographics Similar to Tlingit-Haida by Unemployment Among Ages 20 to 24 years
In terms of unemployment among ages 20 to 24 years, the demographic groups most similar to Tlingit-Haida are Immigrants from Turkey (10.3%, a difference of 0.010%), Okinawan (10.3%, a difference of 0.020%), Alsatian (10.3%, a difference of 0.030%), Immigrants from Czechoslovakia (10.3%, a difference of 0.040%), and Immigrants from Germany (10.4%, a difference of 0.060%).
| Demographics | Rating | Rank | Unemployment Among Ages 20 to 24 years |
| Koreans | 51.9 /100 | #172 | Average 10.3% |
| Immigrants | Sweden | 50.8 /100 | #173 | Average 10.3% |
| Ukrainians | 50.0 /100 | #174 | Average 10.3% |
| Samoans | 45.4 /100 | #175 | Average 10.3% |
| Potawatomi | 42.0 /100 | #176 | Average 10.3% |
| Immigrants | Czechoslovakia | 40.8 /100 | #177 | Average 10.3% |
| Alsatians | 40.5 /100 | #178 | Average 10.3% |
| Tlingit-Haida | 39.7 /100 | #179 | Fair 10.3% |
| Immigrants | Turkey | 39.3 /100 | #180 | Fair 10.3% |
| Okinawans | 39.1 /100 | #181 | Fair 10.3% |
| Immigrants | Germany | 38.1 /100 | #182 | Fair 10.4% |
| Immigrants | Egypt | 37.4 /100 | #183 | Fair 10.4% |
| Greeks | 37.2 /100 | #184 | Fair 10.4% |
| Syrians | 35.6 /100 | #185 | Fair 10.4% |
| Guamanians/Chamorros | 35.4 /100 | #186 | Fair 10.4% |
Demographics Similar to Immigrants from Latin America by Unemployment Among Ages 20 to 24 years
In terms of unemployment among ages 20 to 24 years, the demographic groups most similar to Immigrants from Latin America are Marshallese (11.0%, a difference of 0.29%), Puget Sound Salish (10.9%, a difference of 0.46%), Immigrants from Lebanon (10.9%, a difference of 0.70%), Panamanian (10.9%, a difference of 0.73%), and Dutch West Indian (10.9%, a difference of 0.83%).
| Demographics | Rating | Rank | Unemployment Among Ages 20 to 24 years |
| Immigrants | Israel | 0.3 /100 | #255 | Tragic 10.8% |
| Immigrants | Bahamas | 0.3 /100 | #256 | Tragic 10.9% |
| Immigrants | Western Asia | 0.3 /100 | #257 | Tragic 10.9% |
| Dutch West Indians | 0.3 /100 | #258 | Tragic 10.9% |
| Panamanians | 0.2 /100 | #259 | Tragic 10.9% |
| Immigrants | Lebanon | 0.2 /100 | #260 | Tragic 10.9% |
| Puget Sound Salish | 0.2 /100 | #261 | Tragic 10.9% |
| Immigrants | Latin America | 0.1 /100 | #262 | Tragic 11.0% |
| Marshallese | 0.1 /100 | #263 | Tragic 11.0% |
| Sub-Saharan Africans | 0.0 /100 | #264 | Tragic 11.1% |
| Immigrants | Ireland | 0.0 /100 | #265 | Tragic 11.1% |
| Immigrants | Liberia | 0.0 /100 | #266 | Tragic 11.1% |
| Immigrants | Greece | 0.0 /100 | #267 | Tragic 11.1% |
| Maltese | 0.0 /100 | #268 | Tragic 11.2% |
| Ute | 0.0 /100 | #269 | Tragic 11.2% |