Tlingit-Haida vs Immigrants from England Unemployment Among Ages 20 to 24 years
COMPARE
Tlingit-Haida
Immigrants from England
Unemployment Among Ages 20 to 24 years
Unemployment Among Ages 20 to 24 years Comparison
Tlingit-Haida
Immigrants from England
10.3%
UNEMPLOYMENT AMONG AGES 20 TO 24 YEARS
39.7/ 100
METRIC RATING
179th/ 347
METRIC RANK
10.3%
UNEMPLOYMENT AMONG AGES 20 TO 24 YEARS
63.7/ 100
METRIC RATING
159th/ 347
METRIC RANK
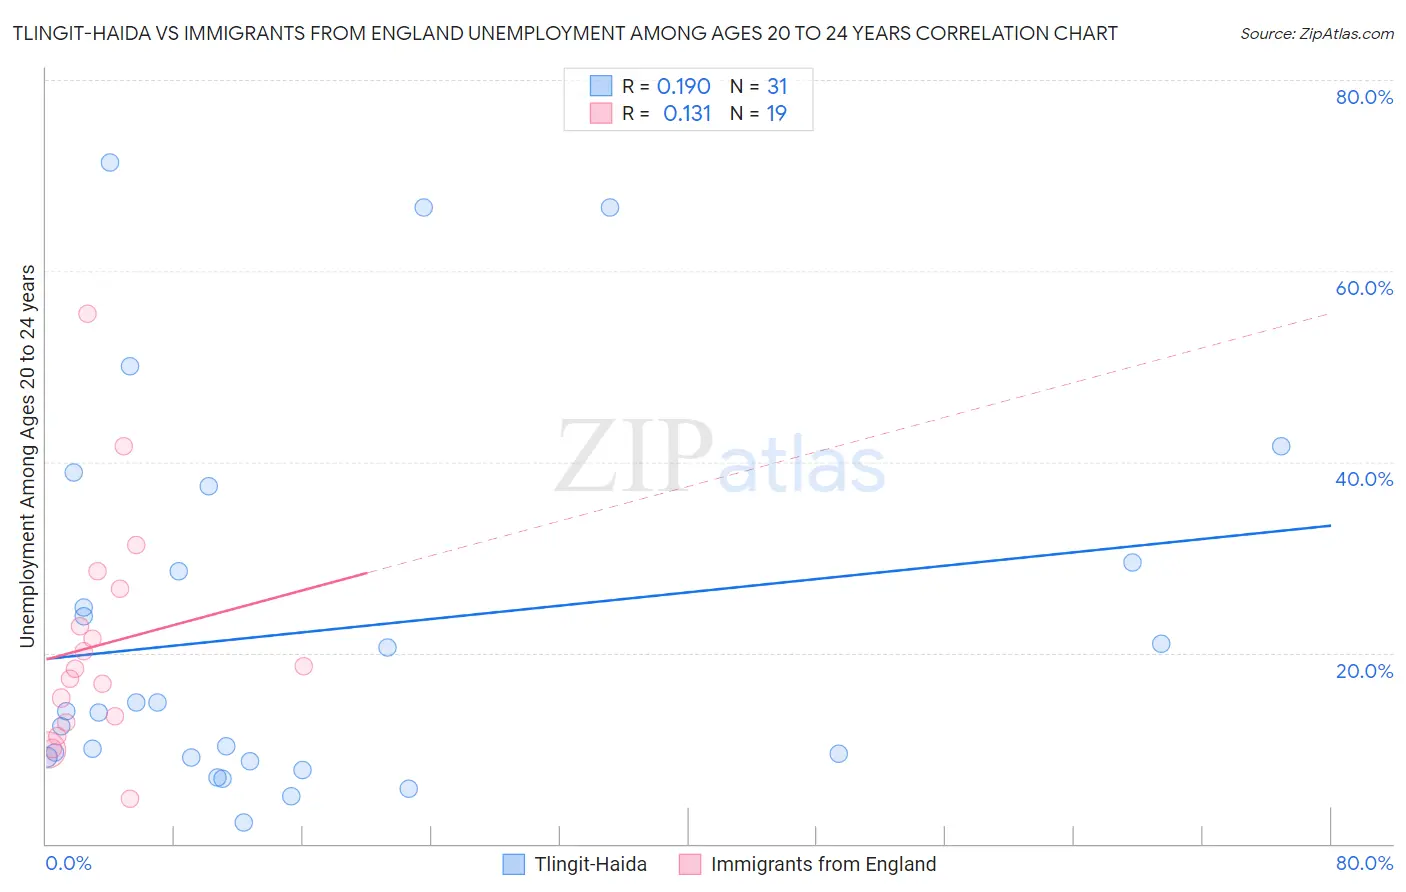
Tlingit-Haida vs Immigrants from England Unemployment Among Ages 20 to 24 years Correlation Chart
The statistical analysis conducted on geographies consisting of 60,175,372 people shows a poor positive correlation between the proportion of Tlingit-Haida and unemployment rate among population between the ages 20 and 24 in the United States with a correlation coefficient (R) of 0.190 and weighted average of 10.3%. Similarly, the statistical analysis conducted on geographies consisting of 378,161,637 people shows a poor positive correlation between the proportion of Immigrants from England and unemployment rate among population between the ages 20 and 24 in the United States with a correlation coefficient (R) of 0.131 and weighted average of 10.3%, a difference of 0.90%.
Unemployment Among Ages 20 to 24 years Correlation Summary
| Measurement | Tlingit-Haida | Immigrants from England |
| Minimum | 2.2% | 4.7% |
| Maximum | 71.4% | 55.5% |
| Range | 69.2% | 50.8% |
| Mean | 22.3% | 20.8% |
| Median | 13.9% | 18.3% |
| Interquartile 25% (IQ1) | 9.0% | 12.6% |
| Interquartile 75% (IQ3) | 29.4% | 26.7% |
| Interquartile Range (IQR) | 20.4% | 14.1% |
| Standard Deviation (Sample) | 19.4% | 12.1% |
| Standard Deviation (Population) | 19.1% | 11.8% |
Demographics Similar to Tlingit-Haida and Immigrants from England by Unemployment Among Ages 20 to 24 years
In terms of unemployment among ages 20 to 24 years, the demographic groups most similar to Tlingit-Haida are Alsatian (10.3%, a difference of 0.030%), Immigrants from Czechoslovakia (10.3%, a difference of 0.040%), Potawatomi (10.3%, a difference of 0.090%), Samoan (10.3%, a difference of 0.22%), and Ukrainian (10.3%, a difference of 0.38%). Similarly, the demographic groups most similar to Immigrants from England are Spaniard (10.3%, a difference of 0.010%), Indian (Asian) (10.3%, a difference of 0.040%), Immigrants from Asia (10.3%, a difference of 0.10%), Estonian (10.3%, a difference of 0.10%), and Immigrants from Korea (10.3%, a difference of 0.18%).
| Demographics | Rating | Rank | Unemployment Among Ages 20 to 24 years |
| Immigrants | England | 63.7 /100 | #159 | Good 10.3% |
| Spaniards | 63.4 /100 | #160 | Good 10.3% |
| Indians (Asian) | 62.6 /100 | #161 | Good 10.3% |
| Immigrants | Asia | 61.3 /100 | #162 | Good 10.3% |
| Estonians | 61.1 /100 | #163 | Good 10.3% |
| Immigrants | Korea | 59.0 /100 | #164 | Average 10.3% |
| Lebanese | 58.3 /100 | #165 | Average 10.3% |
| Italians | 57.7 /100 | #166 | Average 10.3% |
| Immigrants | Fiji | 57.6 /100 | #167 | Average 10.3% |
| Iraqis | 56.7 /100 | #168 | Average 10.3% |
| Immigrants | Colombia | 56.3 /100 | #169 | Average 10.3% |
| Turks | 55.2 /100 | #170 | Average 10.3% |
| Immigrants | Eastern Asia | 52.7 /100 | #171 | Average 10.3% |
| Koreans | 51.9 /100 | #172 | Average 10.3% |
| Immigrants | Sweden | 50.8 /100 | #173 | Average 10.3% |
| Ukrainians | 50.0 /100 | #174 | Average 10.3% |
| Samoans | 45.4 /100 | #175 | Average 10.3% |
| Potawatomi | 42.0 /100 | #176 | Average 10.3% |
| Immigrants | Czechoslovakia | 40.8 /100 | #177 | Average 10.3% |
| Alsatians | 40.5 /100 | #178 | Average 10.3% |
| Tlingit-Haida | 39.7 /100 | #179 | Fair 10.3% |