Tlingit-Haida vs Greek Unemployment Among Ages 20 to 24 years
COMPARE
Tlingit-Haida
Greek
Unemployment Among Ages 20 to 24 years
Unemployment Among Ages 20 to 24 years Comparison
Tlingit-Haida
Greeks
10.3%
UNEMPLOYMENT AMONG AGES 20 TO 24 YEARS
39.7/ 100
METRIC RATING
179th/ 347
METRIC RANK
10.4%
UNEMPLOYMENT AMONG AGES 20 TO 24 YEARS
37.2/ 100
METRIC RATING
184th/ 347
METRIC RANK
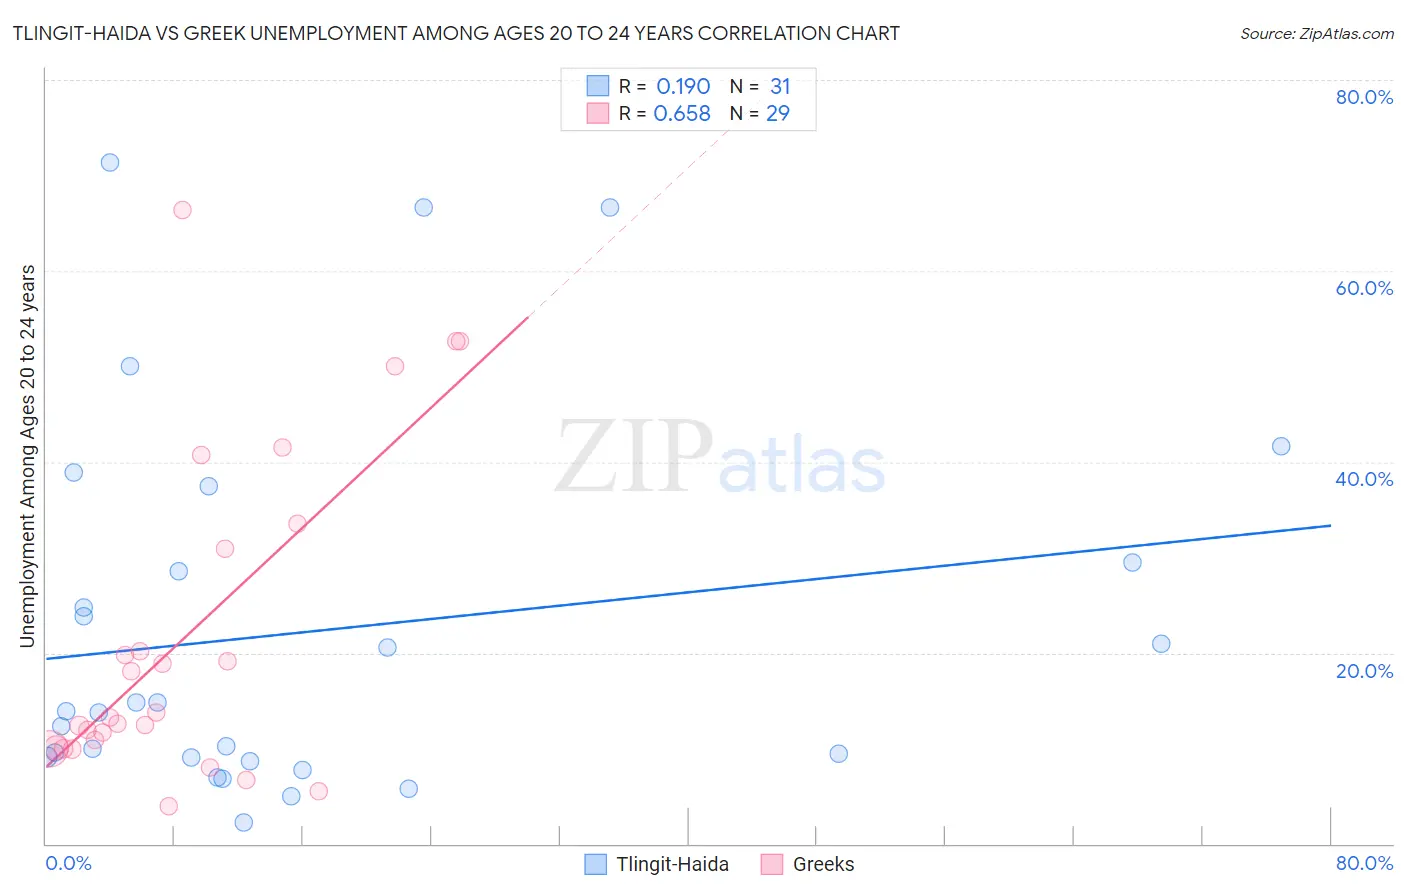
Tlingit-Haida vs Greek Unemployment Among Ages 20 to 24 years Correlation Chart
The statistical analysis conducted on geographies consisting of 60,175,372 people shows a poor positive correlation between the proportion of Tlingit-Haida and unemployment rate among population between the ages 20 and 24 in the United States with a correlation coefficient (R) of 0.190 and weighted average of 10.3%. Similarly, the statistical analysis conducted on geographies consisting of 459,033,350 people shows a significant positive correlation between the proportion of Greeks and unemployment rate among population between the ages 20 and 24 in the United States with a correlation coefficient (R) of 0.658 and weighted average of 10.4%, a difference of 0.10%.
Unemployment Among Ages 20 to 24 years Correlation Summary
| Measurement | Tlingit-Haida | Greek |
| Minimum | 2.2% | 3.9% |
| Maximum | 71.4% | 66.4% |
| Range | 69.2% | 62.5% |
| Mean | 22.3% | 21.6% |
| Median | 13.9% | 13.2% |
| Interquartile 25% (IQ1) | 9.0% | 10.0% |
| Interquartile 75% (IQ3) | 29.4% | 32.2% |
| Interquartile Range (IQR) | 20.4% | 22.2% |
| Standard Deviation (Sample) | 19.4% | 16.9% |
| Standard Deviation (Population) | 19.1% | 16.6% |
Demographics Similar to Tlingit-Haida and Greeks by Unemployment Among Ages 20 to 24 years
In terms of unemployment among ages 20 to 24 years, the demographic groups most similar to Tlingit-Haida are Immigrants from Turkey (10.3%, a difference of 0.010%), Okinawan (10.3%, a difference of 0.020%), Alsatian (10.3%, a difference of 0.030%), Immigrants from Czechoslovakia (10.3%, a difference of 0.040%), and Immigrants from Germany (10.4%, a difference of 0.060%). Similarly, the demographic groups most similar to Greeks are Immigrants from Egypt (10.4%, a difference of 0.010%), Immigrants from Germany (10.4%, a difference of 0.040%), Syrian (10.4%, a difference of 0.060%), Okinawan (10.3%, a difference of 0.070%), and Guamanian/Chamorro (10.4%, a difference of 0.070%).
| Demographics | Rating | Rank | Unemployment Among Ages 20 to 24 years |
| Immigrants | Eastern Asia | 52.7 /100 | #171 | Average 10.3% |
| Koreans | 51.9 /100 | #172 | Average 10.3% |
| Immigrants | Sweden | 50.8 /100 | #173 | Average 10.3% |
| Ukrainians | 50.0 /100 | #174 | Average 10.3% |
| Samoans | 45.4 /100 | #175 | Average 10.3% |
| Potawatomi | 42.0 /100 | #176 | Average 10.3% |
| Immigrants | Czechoslovakia | 40.8 /100 | #177 | Average 10.3% |
| Alsatians | 40.5 /100 | #178 | Average 10.3% |
| Tlingit-Haida | 39.7 /100 | #179 | Fair 10.3% |
| Immigrants | Turkey | 39.3 /100 | #180 | Fair 10.3% |
| Okinawans | 39.1 /100 | #181 | Fair 10.3% |
| Immigrants | Germany | 38.1 /100 | #182 | Fair 10.4% |
| Immigrants | Egypt | 37.4 /100 | #183 | Fair 10.4% |
| Greeks | 37.2 /100 | #184 | Fair 10.4% |
| Syrians | 35.6 /100 | #185 | Fair 10.4% |
| Guamanians/Chamorros | 35.4 /100 | #186 | Fair 10.4% |
| Immigrants | Western Europe | 35.0 /100 | #187 | Fair 10.4% |
| Immigrants | Russia | 34.6 /100 | #188 | Fair 10.4% |
| Hawaiians | 33.9 /100 | #189 | Fair 10.4% |
| Immigrants | China | 32.6 /100 | #190 | Fair 10.4% |
| Immigrants | Eastern Europe | 25.8 /100 | #191 | Fair 10.4% |