Immigrants from Senegal vs Immigrants from Latin America Unemployment Among Ages 20 to 24 years
COMPARE
Immigrants from Senegal
Immigrants from Latin America
Unemployment Among Ages 20 to 24 years
Unemployment Among Ages 20 to 24 years Comparison
Immigrants from Senegal
Immigrants from Latin America
11.9%
UNEMPLOYMENT AMONG AGES 20 TO 24 YEARS
0.0/ 100
METRIC RATING
292nd/ 347
METRIC RANK
11.0%
UNEMPLOYMENT AMONG AGES 20 TO 24 YEARS
0.1/ 100
METRIC RATING
262nd/ 347
METRIC RANK
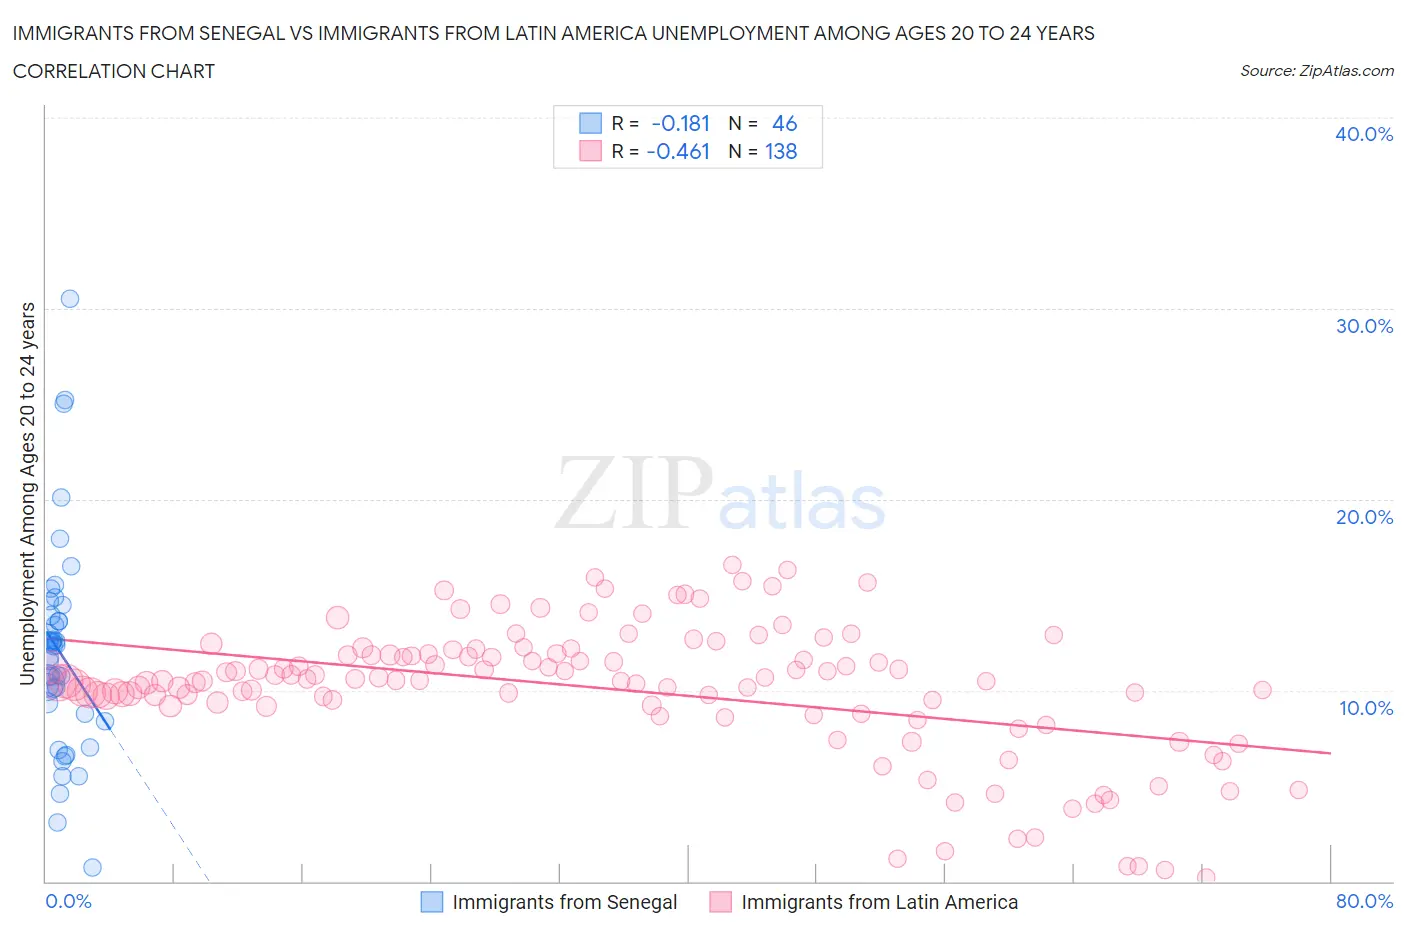
Immigrants from Senegal vs Immigrants from Latin America Unemployment Among Ages 20 to 24 years Correlation Chart
The statistical analysis conducted on geographies consisting of 89,868,284 people shows a poor negative correlation between the proportion of Immigrants from Senegal and unemployment rate among population between the ages 20 and 24 in the United States with a correlation coefficient (R) of -0.181 and weighted average of 11.9%. Similarly, the statistical analysis conducted on geographies consisting of 518,664,657 people shows a moderate negative correlation between the proportion of Immigrants from Latin America and unemployment rate among population between the ages 20 and 24 in the United States with a correlation coefficient (R) of -0.461 and weighted average of 11.0%, a difference of 8.8%.
Unemployment Among Ages 20 to 24 years Correlation Summary
| Measurement | Immigrants from Senegal | Immigrants from Latin America |
| Minimum | 0.70% | 0.20% |
| Maximum | 30.5% | 16.6% |
| Range | 29.8% | 16.4% |
| Mean | 12.0% | 10.1% |
| Median | 12.0% | 10.5% |
| Interquartile 25% (IQ1) | 8.8% | 9.2% |
| Interquartile 75% (IQ3) | 13.9% | 11.9% |
| Interquartile Range (IQR) | 5.1% | 2.7% |
| Standard Deviation (Sample) | 5.6% | 3.5% |
| Standard Deviation (Population) | 5.5% | 3.5% |
Similar Demographics by Unemployment Among Ages 20 to 24 years
Demographics Similar to Immigrants from Senegal by Unemployment Among Ages 20 to 24 years
In terms of unemployment among ages 20 to 24 years, the demographic groups most similar to Immigrants from Senegal are Central American Indian (11.9%, a difference of 0.080%), Immigrants from Ghana (11.9%, a difference of 0.23%), Immigrants from Belize (12.0%, a difference of 0.26%), Immigrants from Armenia (12.0%, a difference of 0.44%), and Cajun (12.0%, a difference of 0.47%).
| Demographics | Rating | Rank | Unemployment Among Ages 20 to 24 years |
| Soviet Union | 0.0 /100 | #285 | Tragic 11.7% |
| Ecuadorians | 0.0 /100 | #286 | Tragic 11.8% |
| Immigrants | Ecuador | 0.0 /100 | #287 | Tragic 11.8% |
| U.S. Virgin Islanders | 0.0 /100 | #288 | Tragic 11.8% |
| Belizeans | 0.0 /100 | #289 | Tragic 11.8% |
| Immigrants | Caribbean | 0.0 /100 | #290 | Tragic 11.8% |
| Central American Indians | 0.0 /100 | #291 | Tragic 11.9% |
| Immigrants | Senegal | 0.0 /100 | #292 | Tragic 11.9% |
| Immigrants | Ghana | 0.0 /100 | #293 | Tragic 11.9% |
| Immigrants | Belize | 0.0 /100 | #294 | Tragic 12.0% |
| Immigrants | Armenia | 0.0 /100 | #295 | Tragic 12.0% |
| Cajuns | 0.0 /100 | #296 | Tragic 12.0% |
| Blackfeet | 0.0 /100 | #297 | Tragic 12.0% |
| Lumbee | 0.0 /100 | #298 | Tragic 12.0% |
| Apache | 0.0 /100 | #299 | Tragic 12.0% |
Demographics Similar to Immigrants from Latin America by Unemployment Among Ages 20 to 24 years
In terms of unemployment among ages 20 to 24 years, the demographic groups most similar to Immigrants from Latin America are Marshallese (11.0%, a difference of 0.29%), Puget Sound Salish (10.9%, a difference of 0.46%), Immigrants from Lebanon (10.9%, a difference of 0.70%), Panamanian (10.9%, a difference of 0.73%), and Dutch West Indian (10.9%, a difference of 0.83%).
| Demographics | Rating | Rank | Unemployment Among Ages 20 to 24 years |
| Immigrants | Israel | 0.3 /100 | #255 | Tragic 10.8% |
| Immigrants | Bahamas | 0.3 /100 | #256 | Tragic 10.9% |
| Immigrants | Western Asia | 0.3 /100 | #257 | Tragic 10.9% |
| Dutch West Indians | 0.3 /100 | #258 | Tragic 10.9% |
| Panamanians | 0.2 /100 | #259 | Tragic 10.9% |
| Immigrants | Lebanon | 0.2 /100 | #260 | Tragic 10.9% |
| Puget Sound Salish | 0.2 /100 | #261 | Tragic 10.9% |
| Immigrants | Latin America | 0.1 /100 | #262 | Tragic 11.0% |
| Marshallese | 0.1 /100 | #263 | Tragic 11.0% |
| Sub-Saharan Africans | 0.0 /100 | #264 | Tragic 11.1% |
| Immigrants | Ireland | 0.0 /100 | #265 | Tragic 11.1% |
| Immigrants | Liberia | 0.0 /100 | #266 | Tragic 11.1% |
| Immigrants | Greece | 0.0 /100 | #267 | Tragic 11.1% |
| Maltese | 0.0 /100 | #268 | Tragic 11.2% |
| Ute | 0.0 /100 | #269 | Tragic 11.2% |