Tlingit-Haida vs Hispanic or Latino Unemployment Among Ages 20 to 24 years
COMPARE
Tlingit-Haida
Hispanic or Latino
Unemployment Among Ages 20 to 24 years
Unemployment Among Ages 20 to 24 years Comparison
Tlingit-Haida
Hispanics or Latinos
10.3%
UNEMPLOYMENT AMONG AGES 20 TO 24 YEARS
39.7/ 100
METRIC RATING
179th/ 347
METRIC RANK
10.7%
UNEMPLOYMENT AMONG AGES 20 TO 24 YEARS
1.0/ 100
METRIC RATING
245th/ 347
METRIC RANK
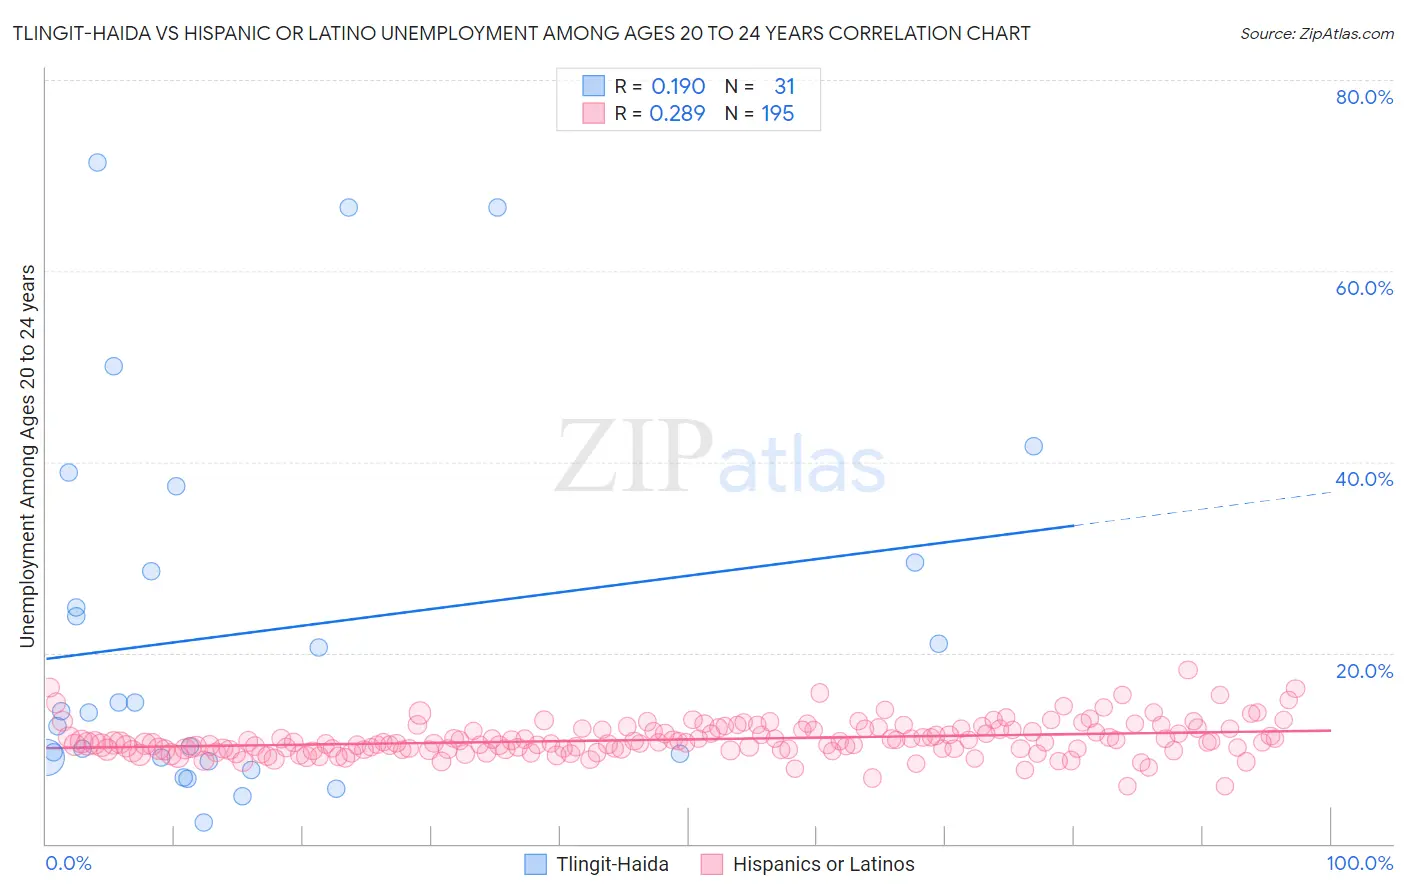
Tlingit-Haida vs Hispanic or Latino Unemployment Among Ages 20 to 24 years Correlation Chart
The statistical analysis conducted on geographies consisting of 60,175,372 people shows a poor positive correlation between the proportion of Tlingit-Haida and unemployment rate among population between the ages 20 and 24 in the United States with a correlation coefficient (R) of 0.190 and weighted average of 10.3%. Similarly, the statistical analysis conducted on geographies consisting of 523,810,007 people shows a weak positive correlation between the proportion of Hispanics or Latinos and unemployment rate among population between the ages 20 and 24 in the United States with a correlation coefficient (R) of 0.289 and weighted average of 10.7%, a difference of 3.8%.
Unemployment Among Ages 20 to 24 years Correlation Summary
| Measurement | Tlingit-Haida | Hispanic or Latino |
| Minimum | 2.2% | 6.0% |
| Maximum | 71.4% | 18.2% |
| Range | 69.2% | 12.2% |
| Mean | 22.3% | 10.9% |
| Median | 13.9% | 10.6% |
| Interquartile 25% (IQ1) | 9.0% | 9.9% |
| Interquartile 75% (IQ3) | 29.4% | 12.0% |
| Interquartile Range (IQR) | 20.4% | 2.1% |
| Standard Deviation (Sample) | 19.4% | 1.8% |
| Standard Deviation (Population) | 19.1% | 1.8% |
Similar Demographics by Unemployment Among Ages 20 to 24 years
Demographics Similar to Tlingit-Haida by Unemployment Among Ages 20 to 24 years
In terms of unemployment among ages 20 to 24 years, the demographic groups most similar to Tlingit-Haida are Immigrants from Turkey (10.3%, a difference of 0.010%), Okinawan (10.3%, a difference of 0.020%), Alsatian (10.3%, a difference of 0.030%), Immigrants from Czechoslovakia (10.3%, a difference of 0.040%), and Immigrants from Germany (10.4%, a difference of 0.060%).
| Demographics | Rating | Rank | Unemployment Among Ages 20 to 24 years |
| Koreans | 51.9 /100 | #172 | Average 10.3% |
| Immigrants | Sweden | 50.8 /100 | #173 | Average 10.3% |
| Ukrainians | 50.0 /100 | #174 | Average 10.3% |
| Samoans | 45.4 /100 | #175 | Average 10.3% |
| Potawatomi | 42.0 /100 | #176 | Average 10.3% |
| Immigrants | Czechoslovakia | 40.8 /100 | #177 | Average 10.3% |
| Alsatians | 40.5 /100 | #178 | Average 10.3% |
| Tlingit-Haida | 39.7 /100 | #179 | Fair 10.3% |
| Immigrants | Turkey | 39.3 /100 | #180 | Fair 10.3% |
| Okinawans | 39.1 /100 | #181 | Fair 10.3% |
| Immigrants | Germany | 38.1 /100 | #182 | Fair 10.4% |
| Immigrants | Egypt | 37.4 /100 | #183 | Fair 10.4% |
| Greeks | 37.2 /100 | #184 | Fair 10.4% |
| Syrians | 35.6 /100 | #185 | Fair 10.4% |
| Guamanians/Chamorros | 35.4 /100 | #186 | Fair 10.4% |
Demographics Similar to Hispanics or Latinos by Unemployment Among Ages 20 to 24 years
In terms of unemployment among ages 20 to 24 years, the demographic groups most similar to Hispanics or Latinos are Immigrants from Iran (10.8%, a difference of 0.13%), Immigrants from Mexico (10.7%, a difference of 0.19%), Immigrants from Belarus (10.7%, a difference of 0.25%), Moroccan (10.7%, a difference of 0.29%), and Immigrants from Albania (10.8%, a difference of 0.34%).
| Demographics | Rating | Rank | Unemployment Among Ages 20 to 24 years |
| Immigrants | Pakistan | 2.6 /100 | #238 | Tragic 10.6% |
| Salvadorans | 2.4 /100 | #239 | Tragic 10.7% |
| Immigrants | Central America | 2.0 /100 | #240 | Tragic 10.7% |
| Immigrants | El Salvador | 1.7 /100 | #241 | Tragic 10.7% |
| Moroccans | 1.4 /100 | #242 | Tragic 10.7% |
| Immigrants | Belarus | 1.3 /100 | #243 | Tragic 10.7% |
| Immigrants | Mexico | 1.2 /100 | #244 | Tragic 10.7% |
| Hispanics or Latinos | 1.0 /100 | #245 | Tragic 10.7% |
| Immigrants | Iran | 0.9 /100 | #246 | Tragic 10.8% |
| Immigrants | Albania | 0.7 /100 | #247 | Tragic 10.8% |
| Cree | 0.6 /100 | #248 | Tragic 10.8% |
| South American Indians | 0.5 /100 | #249 | Tragic 10.8% |
| Albanians | 0.5 /100 | #250 | Tragic 10.8% |
| Immigrants | Panama | 0.4 /100 | #251 | Tragic 10.8% |
| Immigrants | Syria | 0.4 /100 | #252 | Tragic 10.8% |