Afghan vs Hispanic or Latino Unemployment Among Ages 20 to 24 years
COMPARE
Afghan
Hispanic or Latino
Unemployment Among Ages 20 to 24 years
Unemployment Among Ages 20 to 24 years Comparison
Afghans
Hispanics or Latinos
9.6%
UNEMPLOYMENT AMONG AGES 20 TO 24 YEARS
99.9/ 100
METRIC RATING
38th/ 347
METRIC RANK
10.7%
UNEMPLOYMENT AMONG AGES 20 TO 24 YEARS
1.0/ 100
METRIC RATING
245th/ 347
METRIC RANK
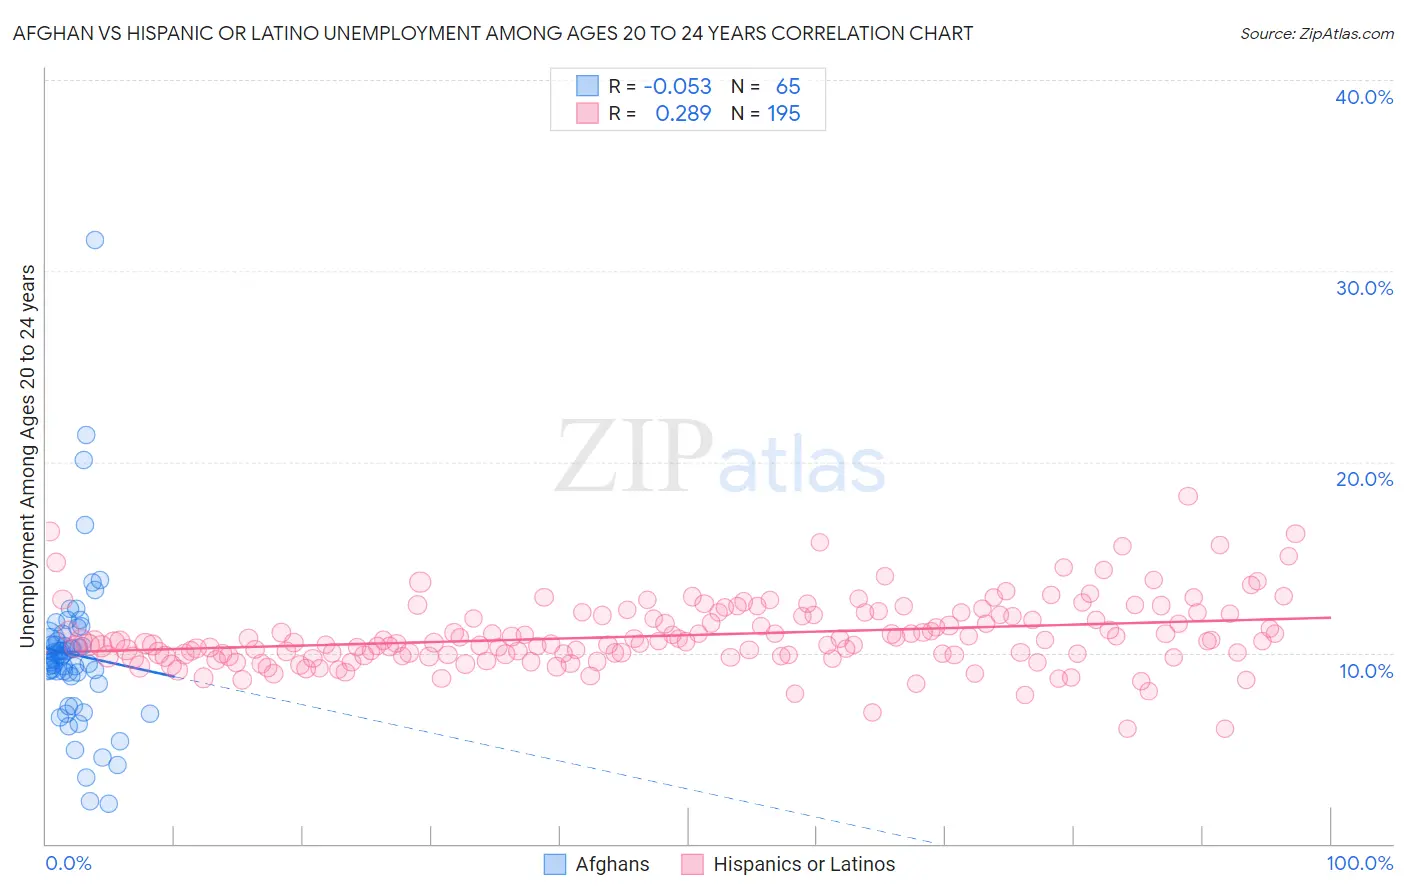
Afghan vs Hispanic or Latino Unemployment Among Ages 20 to 24 years Correlation Chart
The statistical analysis conducted on geographies consisting of 147,858,089 people shows a slight negative correlation between the proportion of Afghans and unemployment rate among population between the ages 20 and 24 in the United States with a correlation coefficient (R) of -0.053 and weighted average of 9.6%. Similarly, the statistical analysis conducted on geographies consisting of 523,810,007 people shows a weak positive correlation between the proportion of Hispanics or Latinos and unemployment rate among population between the ages 20 and 24 in the United States with a correlation coefficient (R) of 0.289 and weighted average of 10.7%, a difference of 11.9%.
Unemployment Among Ages 20 to 24 years Correlation Summary
| Measurement | Afghan | Hispanic or Latino |
| Minimum | 2.1% | 6.0% |
| Maximum | 31.6% | 18.2% |
| Range | 29.5% | 12.2% |
| Mean | 9.9% | 10.9% |
| Median | 9.7% | 10.6% |
| Interquartile 25% (IQ1) | 8.6% | 9.9% |
| Interquartile 75% (IQ3) | 10.7% | 12.0% |
| Interquartile Range (IQR) | 2.1% | 2.1% |
| Standard Deviation (Sample) | 4.3% | 1.8% |
| Standard Deviation (Population) | 4.3% | 1.8% |
Similar Demographics by Unemployment Among Ages 20 to 24 years
Demographics Similar to Afghans by Unemployment Among Ages 20 to 24 years
In terms of unemployment among ages 20 to 24 years, the demographic groups most similar to Afghans are Immigrants from Zaire (9.6%, a difference of 0.070%), Belgian (9.6%, a difference of 0.15%), German (9.6%, a difference of 0.18%), Dutch (9.6%, a difference of 0.22%), and Yugoslavian (9.6%, a difference of 0.25%).
| Demographics | Rating | Rank | Unemployment Among Ages 20 to 24 years |
| Immigrants | Eastern Africa | 100.0 /100 | #31 | Exceptional 9.5% |
| Cambodians | 100.0 /100 | #32 | Exceptional 9.5% |
| Australians | 100.0 /100 | #33 | Exceptional 9.6% |
| Yugoslavians | 100.0 /100 | #34 | Exceptional 9.6% |
| Germans | 100.0 /100 | #35 | Exceptional 9.6% |
| Belgians | 100.0 /100 | #36 | Exceptional 9.6% |
| Immigrants | Zaire | 100.0 /100 | #37 | Exceptional 9.6% |
| Afghans | 99.9 /100 | #38 | Exceptional 9.6% |
| Dutch | 99.9 /100 | #39 | Exceptional 9.6% |
| Immigrants | Ethiopia | 99.9 /100 | #40 | Exceptional 9.6% |
| Swiss | 99.9 /100 | #41 | Exceptional 9.7% |
| Immigrants | Saudi Arabia | 99.9 /100 | #42 | Exceptional 9.7% |
| Menominee | 99.8 /100 | #43 | Exceptional 9.7% |
| Europeans | 99.8 /100 | #44 | Exceptional 9.7% |
| Croatians | 99.8 /100 | #45 | Exceptional 9.7% |
Demographics Similar to Hispanics or Latinos by Unemployment Among Ages 20 to 24 years
In terms of unemployment among ages 20 to 24 years, the demographic groups most similar to Hispanics or Latinos are Immigrants from Iran (10.8%, a difference of 0.13%), Immigrants from Mexico (10.7%, a difference of 0.19%), Immigrants from Belarus (10.7%, a difference of 0.25%), Moroccan (10.7%, a difference of 0.29%), and Immigrants from Albania (10.8%, a difference of 0.34%).
| Demographics | Rating | Rank | Unemployment Among Ages 20 to 24 years |
| Immigrants | Pakistan | 2.6 /100 | #238 | Tragic 10.6% |
| Salvadorans | 2.4 /100 | #239 | Tragic 10.7% |
| Immigrants | Central America | 2.0 /100 | #240 | Tragic 10.7% |
| Immigrants | El Salvador | 1.7 /100 | #241 | Tragic 10.7% |
| Moroccans | 1.4 /100 | #242 | Tragic 10.7% |
| Immigrants | Belarus | 1.3 /100 | #243 | Tragic 10.7% |
| Immigrants | Mexico | 1.2 /100 | #244 | Tragic 10.7% |
| Hispanics or Latinos | 1.0 /100 | #245 | Tragic 10.7% |
| Immigrants | Iran | 0.9 /100 | #246 | Tragic 10.8% |
| Immigrants | Albania | 0.7 /100 | #247 | Tragic 10.8% |
| Cree | 0.6 /100 | #248 | Tragic 10.8% |
| South American Indians | 0.5 /100 | #249 | Tragic 10.8% |
| Albanians | 0.5 /100 | #250 | Tragic 10.8% |
| Immigrants | Panama | 0.4 /100 | #251 | Tragic 10.8% |
| Immigrants | Syria | 0.4 /100 | #252 | Tragic 10.8% |