Somali vs Greek Unemployment Among Ages 20 to 24 years
COMPARE
Somali
Greek
Unemployment Among Ages 20 to 24 years
Unemployment Among Ages 20 to 24 years Comparison
Somalis
Greeks
9.1%
UNEMPLOYMENT AMONG AGES 20 TO 24 YEARS
100.0/ 100
METRIC RATING
8th/ 347
METRIC RANK
10.4%
UNEMPLOYMENT AMONG AGES 20 TO 24 YEARS
37.2/ 100
METRIC RATING
184th/ 347
METRIC RANK
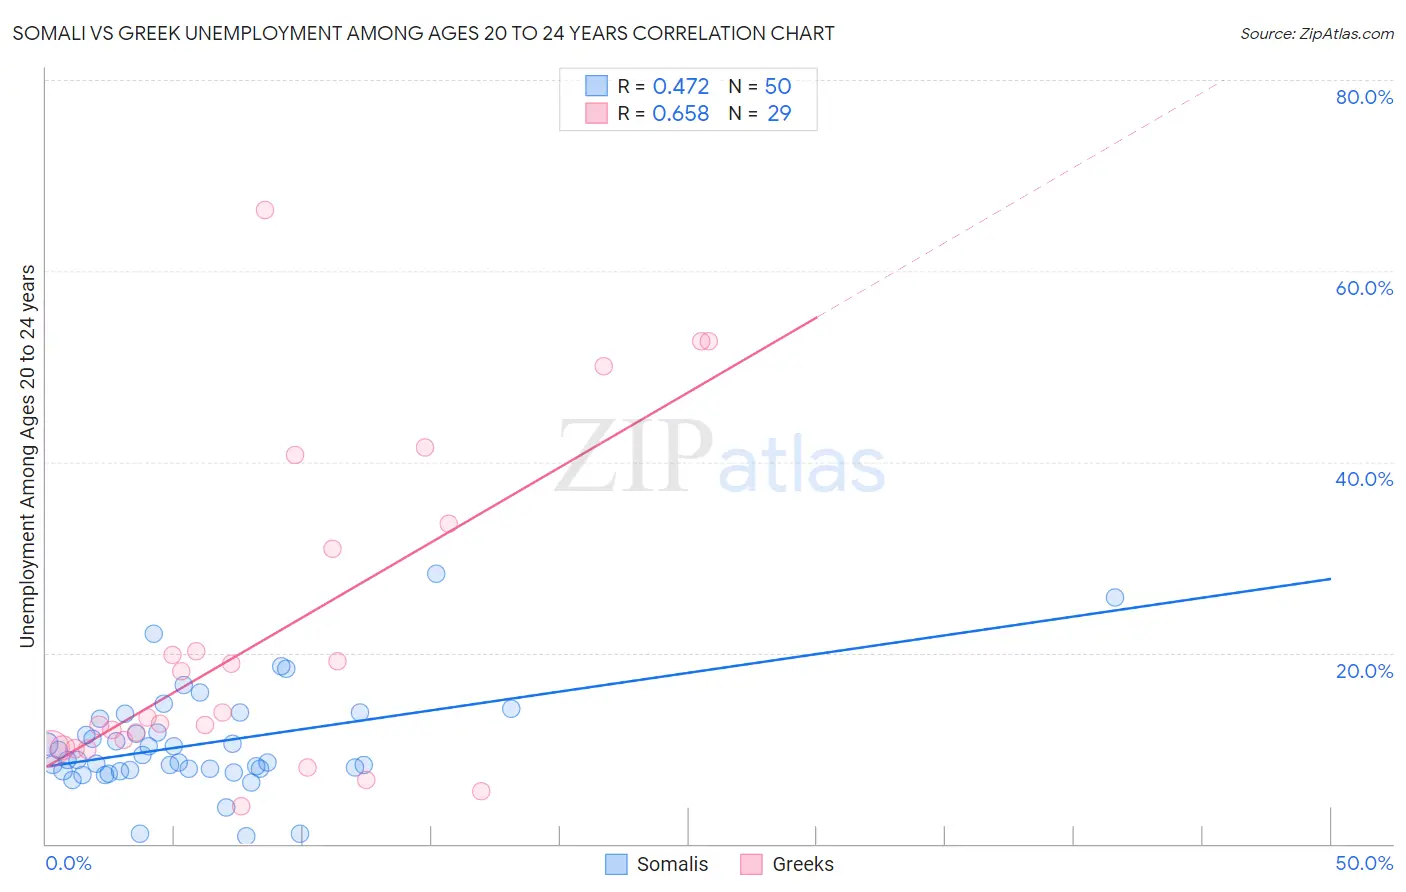
Somali vs Greek Unemployment Among Ages 20 to 24 years Correlation Chart
The statistical analysis conducted on geographies consisting of 98,777,314 people shows a moderate positive correlation between the proportion of Somalis and unemployment rate among population between the ages 20 and 24 in the United States with a correlation coefficient (R) of 0.472 and weighted average of 9.1%. Similarly, the statistical analysis conducted on geographies consisting of 459,033,350 people shows a significant positive correlation between the proportion of Greeks and unemployment rate among population between the ages 20 and 24 in the United States with a correlation coefficient (R) of 0.658 and weighted average of 10.4%, a difference of 13.6%.
Unemployment Among Ages 20 to 24 years Correlation Summary
| Measurement | Somali | Greek |
| Minimum | 0.80% | 3.9% |
| Maximum | 28.3% | 66.4% |
| Range | 27.5% | 62.5% |
| Mean | 10.5% | 21.6% |
| Median | 8.8% | 13.2% |
| Interquartile 25% (IQ1) | 7.7% | 10.0% |
| Interquartile 75% (IQ3) | 13.1% | 32.2% |
| Interquartile Range (IQR) | 5.4% | 22.2% |
| Standard Deviation (Sample) | 5.4% | 16.9% |
| Standard Deviation (Population) | 5.4% | 16.6% |
Similar Demographics by Unemployment Among Ages 20 to 24 years
Demographics Similar to Somalis by Unemployment Among Ages 20 to 24 years
In terms of unemployment among ages 20 to 24 years, the demographic groups most similar to Somalis are Luxembourger (9.1%, a difference of 0.020%), Immigrants from Somalia (9.2%, a difference of 0.35%), Immigrants from Burma/Myanmar (9.1%, a difference of 0.38%), Sudanese (9.2%, a difference of 0.56%), and Norwegian (9.0%, a difference of 0.99%).
| Demographics | Rating | Rank | Unemployment Among Ages 20 to 24 years |
| Immigrants | Cuba | 100.0 /100 | #1 | Exceptional 8.7% |
| Immigrants | Venezuela | 100.0 /100 | #2 | Exceptional 8.9% |
| Indonesians | 100.0 /100 | #3 | Exceptional 9.0% |
| Venezuelans | 100.0 /100 | #4 | Exceptional 9.0% |
| Norwegians | 100.0 /100 | #5 | Exceptional 9.0% |
| Immigrants | Burma/Myanmar | 100.0 /100 | #6 | Exceptional 9.1% |
| Luxembourgers | 100.0 /100 | #7 | Exceptional 9.1% |
| Somalis | 100.0 /100 | #8 | Exceptional 9.1% |
| Immigrants | Somalia | 100.0 /100 | #9 | Exceptional 9.2% |
| Sudanese | 100.0 /100 | #10 | Exceptional 9.2% |
| Zimbabweans | 100.0 /100 | #11 | Exceptional 9.2% |
| Cubans | 100.0 /100 | #12 | Exceptional 9.2% |
| Immigrants | Congo | 100.0 /100 | #13 | Exceptional 9.2% |
| Slovenes | 100.0 /100 | #14 | Exceptional 9.3% |
| Immigrants | Sudan | 100.0 /100 | #15 | Exceptional 9.3% |
Demographics Similar to Greeks by Unemployment Among Ages 20 to 24 years
In terms of unemployment among ages 20 to 24 years, the demographic groups most similar to Greeks are Immigrants from Egypt (10.4%, a difference of 0.010%), Immigrants from Germany (10.4%, a difference of 0.040%), Syrian (10.4%, a difference of 0.060%), Okinawan (10.3%, a difference of 0.070%), and Guamanian/Chamorro (10.4%, a difference of 0.070%).
| Demographics | Rating | Rank | Unemployment Among Ages 20 to 24 years |
| Immigrants | Czechoslovakia | 40.8 /100 | #177 | Average 10.3% |
| Alsatians | 40.5 /100 | #178 | Average 10.3% |
| Tlingit-Haida | 39.7 /100 | #179 | Fair 10.3% |
| Immigrants | Turkey | 39.3 /100 | #180 | Fair 10.3% |
| Okinawans | 39.1 /100 | #181 | Fair 10.3% |
| Immigrants | Germany | 38.1 /100 | #182 | Fair 10.4% |
| Immigrants | Egypt | 37.4 /100 | #183 | Fair 10.4% |
| Greeks | 37.2 /100 | #184 | Fair 10.4% |
| Syrians | 35.6 /100 | #185 | Fair 10.4% |
| Guamanians/Chamorros | 35.4 /100 | #186 | Fair 10.4% |
| Immigrants | Western Europe | 35.0 /100 | #187 | Fair 10.4% |
| Immigrants | Russia | 34.6 /100 | #188 | Fair 10.4% |
| Hawaiians | 33.9 /100 | #189 | Fair 10.4% |
| Immigrants | China | 32.6 /100 | #190 | Fair 10.4% |
| Immigrants | Eastern Europe | 25.8 /100 | #191 | Fair 10.4% |