Immigrants from Belgium vs Cuban Unemployment Among Ages 20 to 24 years
COMPARE
Immigrants from Belgium
Cuban
Unemployment Among Ages 20 to 24 years
Unemployment Among Ages 20 to 24 years Comparison
Immigrants from Belgium
Cubans
10.5%
UNEMPLOYMENT AMONG AGES 20 TO 24 YEARS
16.9/ 100
METRIC RATING
210th/ 347
METRIC RANK
9.2%
UNEMPLOYMENT AMONG AGES 20 TO 24 YEARS
100.0/ 100
METRIC RATING
12th/ 347
METRIC RANK
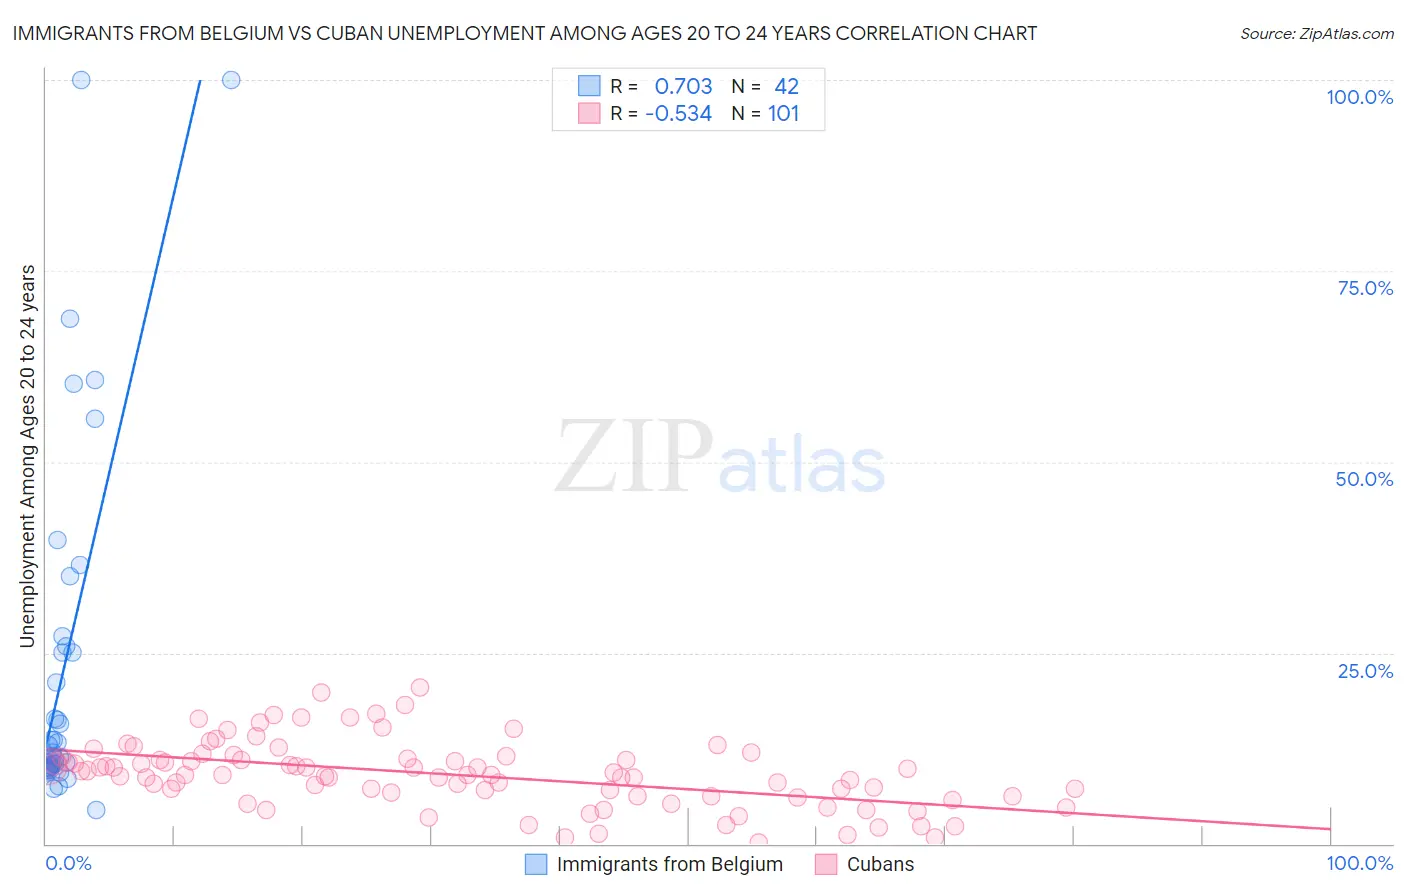
Immigrants from Belgium vs Cuban Unemployment Among Ages 20 to 24 years Correlation Chart
The statistical analysis conducted on geographies consisting of 144,629,585 people shows a strong positive correlation between the proportion of Immigrants from Belgium and unemployment rate among population between the ages 20 and 24 in the United States with a correlation coefficient (R) of 0.703 and weighted average of 10.5%. Similarly, the statistical analysis conducted on geographies consisting of 433,228,061 people shows a substantial negative correlation between the proportion of Cubans and unemployment rate among population between the ages 20 and 24 in the United States with a correlation coefficient (R) of -0.534 and weighted average of 9.2%, a difference of 13.4%.
Unemployment Among Ages 20 to 24 years Correlation Summary
| Measurement | Immigrants from Belgium | Cuban |
| Minimum | 4.5% | 0.20% |
| Maximum | 100.0% | 20.4% |
| Range | 95.5% | 20.2% |
| Mean | 23.5% | 9.1% |
| Median | 12.4% | 9.0% |
| Interquartile 25% (IQ1) | 10.1% | 6.2% |
| Interquartile 75% (IQ3) | 25.9% | 11.3% |
| Interquartile Range (IQR) | 15.8% | 5.0% |
| Standard Deviation (Sample) | 23.5% | 4.3% |
| Standard Deviation (Population) | 23.3% | 4.3% |
Similar Demographics by Unemployment Among Ages 20 to 24 years
Demographics Similar to Immigrants from Belgium by Unemployment Among Ages 20 to 24 years
In terms of unemployment among ages 20 to 24 years, the demographic groups most similar to Immigrants from Belgium are Peruvian (10.5%, a difference of 0.020%), Immigrants from Hong Kong (10.5%, a difference of 0.040%), Immigrants from Honduras (10.4%, a difference of 0.060%), Immigrants from Europe (10.4%, a difference of 0.10%), and Cypriot (10.4%, a difference of 0.12%).
| Demographics | Rating | Rank | Unemployment Among Ages 20 to 24 years |
| South Americans | 20.6 /100 | #203 | Fair 10.4% |
| Immigrants | Northern Europe | 19.5 /100 | #204 | Poor 10.4% |
| Cypriots | 18.9 /100 | #205 | Poor 10.4% |
| Immigrants | Europe | 18.5 /100 | #206 | Poor 10.4% |
| Immigrants | Honduras | 17.9 /100 | #207 | Poor 10.4% |
| Immigrants | Hong Kong | 17.6 /100 | #208 | Poor 10.5% |
| Peruvians | 17.2 /100 | #209 | Poor 10.5% |
| Immigrants | Belgium | 16.9 /100 | #210 | Poor 10.5% |
| Immigrants | Guatemala | 14.6 /100 | #211 | Poor 10.5% |
| Immigrants | Sri Lanka | 14.0 /100 | #212 | Poor 10.5% |
| Guatemalans | 12.2 /100 | #213 | Poor 10.5% |
| Kiowa | 11.7 /100 | #214 | Poor 10.5% |
| Hondurans | 10.5 /100 | #215 | Poor 10.5% |
| Costa Ricans | 9.6 /100 | #216 | Tragic 10.5% |
| Cherokee | 9.3 /100 | #217 | Tragic 10.5% |
Demographics Similar to Cubans by Unemployment Among Ages 20 to 24 years
In terms of unemployment among ages 20 to 24 years, the demographic groups most similar to Cubans are Immigrants from Congo (9.2%, a difference of 0.080%), Zimbabwean (9.2%, a difference of 0.10%), Slovene (9.3%, a difference of 0.47%), Immigrants from Sudan (9.3%, a difference of 0.49%), and Sudanese (9.2%, a difference of 0.55%).
| Demographics | Rating | Rank | Unemployment Among Ages 20 to 24 years |
| Norwegians | 100.0 /100 | #5 | Exceptional 9.0% |
| Immigrants | Burma/Myanmar | 100.0 /100 | #6 | Exceptional 9.1% |
| Luxembourgers | 100.0 /100 | #7 | Exceptional 9.1% |
| Somalis | 100.0 /100 | #8 | Exceptional 9.1% |
| Immigrants | Somalia | 100.0 /100 | #9 | Exceptional 9.2% |
| Sudanese | 100.0 /100 | #10 | Exceptional 9.2% |
| Zimbabweans | 100.0 /100 | #11 | Exceptional 9.2% |
| Cubans | 100.0 /100 | #12 | Exceptional 9.2% |
| Immigrants | Congo | 100.0 /100 | #13 | Exceptional 9.2% |
| Slovenes | 100.0 /100 | #14 | Exceptional 9.3% |
| Immigrants | Sudan | 100.0 /100 | #15 | Exceptional 9.3% |
| Danes | 100.0 /100 | #16 | Exceptional 9.3% |
| Czechs | 100.0 /100 | #17 | Exceptional 9.3% |
| Chinese | 100.0 /100 | #18 | Exceptional 9.4% |
| Hmong | 100.0 /100 | #19 | Exceptional 9.4% |