Thai vs Basque Unemployment Among Ages 20 to 24 years
COMPARE
Thai
Basque
Unemployment Among Ages 20 to 24 years
Unemployment Among Ages 20 to 24 years Comparison
Thais
Basques
10.0%
UNEMPLOYMENT AMONG AGES 20 TO 24 YEARS
96.2/ 100
METRIC RATING
96th/ 347
METRIC RANK
10.1%
UNEMPLOYMENT AMONG AGES 20 TO 24 YEARS
89.8/ 100
METRIC RATING
116th/ 347
METRIC RANK
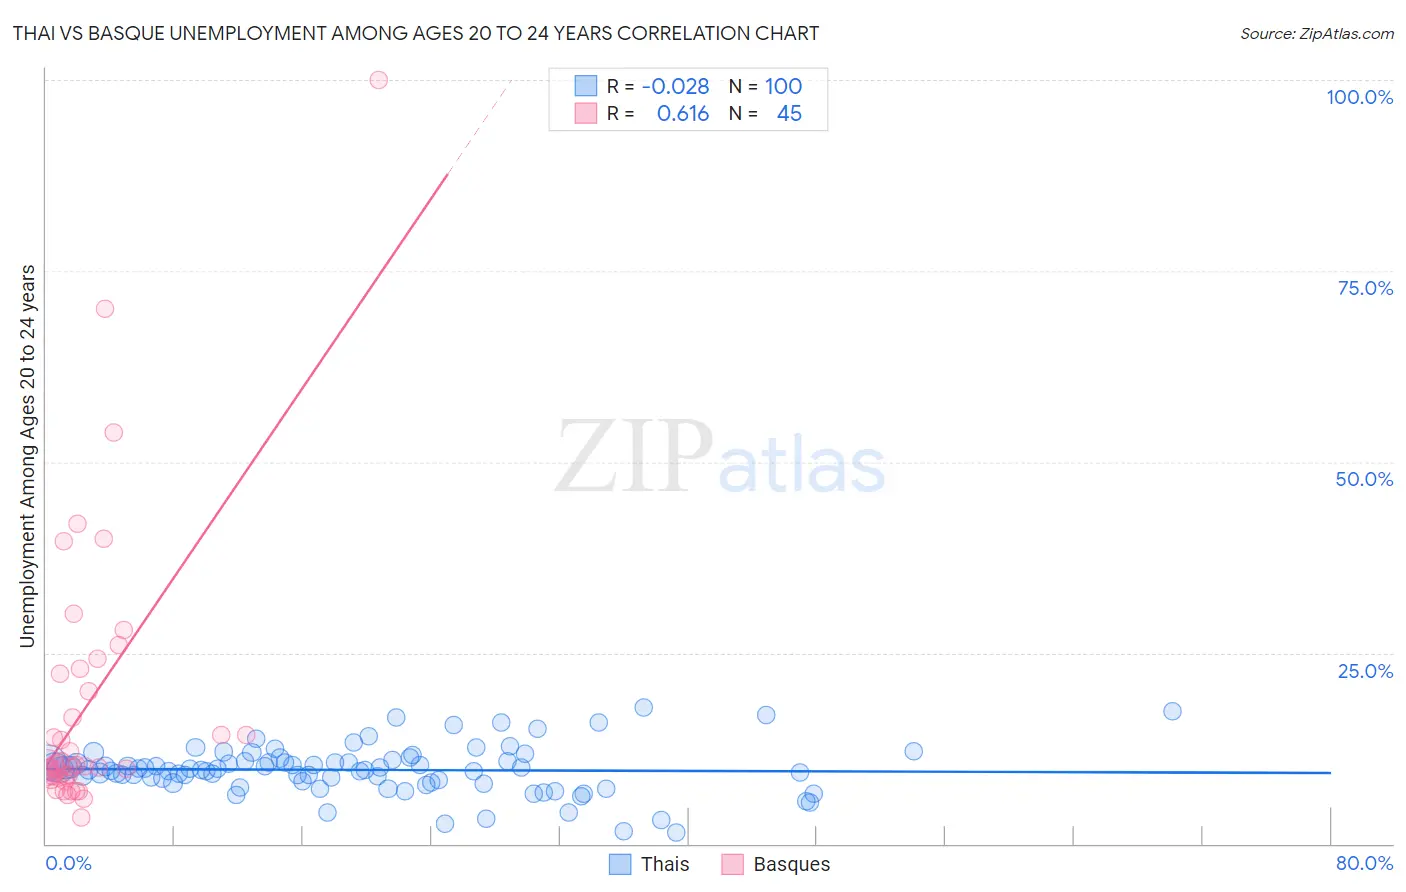
Thai vs Basque Unemployment Among Ages 20 to 24 years Correlation Chart
The statistical analysis conducted on geographies consisting of 457,745,376 people shows no correlation between the proportion of Thais and unemployment rate among population between the ages 20 and 24 in the United States with a correlation coefficient (R) of -0.028 and weighted average of 10.0%. Similarly, the statistical analysis conducted on geographies consisting of 163,440,672 people shows a significant positive correlation between the proportion of Basques and unemployment rate among population between the ages 20 and 24 in the United States with a correlation coefficient (R) of 0.616 and weighted average of 10.1%, a difference of 1.0%.
Unemployment Among Ages 20 to 24 years Correlation Summary
| Measurement | Thai | Basque |
| Minimum | 1.5% | 3.5% |
| Maximum | 17.9% | 100.0% |
| Range | 16.4% | 96.5% |
| Mean | 9.7% | 18.4% |
| Median | 9.7% | 10.2% |
| Interquartile 25% (IQ1) | 8.1% | 8.7% |
| Interquartile 75% (IQ3) | 10.8% | 22.5% |
| Interquartile Range (IQR) | 2.7% | 13.8% |
| Standard Deviation (Sample) | 3.1% | 18.5% |
| Standard Deviation (Population) | 3.1% | 18.3% |
Demographics Similar to Thais and Basques by Unemployment Among Ages 20 to 24 years
In terms of unemployment among ages 20 to 24 years, the demographic groups most similar to Thais are Slavic (10.0%, a difference of 0.040%), Japanese (10.0%, a difference of 0.20%), Fijian (10.0%, a difference of 0.21%), Immigrants from France (10.0%, a difference of 0.22%), and Laotian (10.0%, a difference of 0.25%). Similarly, the demographic groups most similar to Basques are Immigrants from Morocco (10.1%, a difference of 0.070%), Ottawa (10.1%, a difference of 0.12%), German Russian (10.1%, a difference of 0.31%), Northern European (10.1%, a difference of 0.34%), and Immigrants from Indonesia (10.1%, a difference of 0.35%).
| Demographics | Rating | Rank | Unemployment Among Ages 20 to 24 years |
| Thais | 96.2 /100 | #96 | Exceptional 10.0% |
| Slavs | 96.1 /100 | #97 | Exceptional 10.0% |
| Japanese | 95.4 /100 | #98 | Exceptional 10.0% |
| Fijians | 95.3 /100 | #99 | Exceptional 10.0% |
| Immigrants | France | 95.2 /100 | #100 | Exceptional 10.0% |
| Laotians | 95.1 /100 | #101 | Exceptional 10.0% |
| Immigrants | Argentina | 94.9 /100 | #102 | Exceptional 10.0% |
| Irish | 94.3 /100 | #103 | Exceptional 10.0% |
| Immigrants | Chile | 94.0 /100 | #104 | Exceptional 10.0% |
| Immigrants | Hungary | 94.0 /100 | #105 | Exceptional 10.0% |
| Pennsylvania Germans | 93.9 /100 | #106 | Exceptional 10.0% |
| Iroquois | 93.4 /100 | #107 | Exceptional 10.1% |
| Immigrants | Latvia | 93.2 /100 | #108 | Exceptional 10.1% |
| Filipinos | 93.2 /100 | #109 | Exceptional 10.1% |
| Immigrants | Spain | 93.1 /100 | #110 | Exceptional 10.1% |
| Immigrants | Indonesia | 92.7 /100 | #111 | Exceptional 10.1% |
| Northern Europeans | 92.7 /100 | #112 | Exceptional 10.1% |
| German Russians | 92.4 /100 | #113 | Exceptional 10.1% |
| Ottawa | 90.8 /100 | #114 | Exceptional 10.1% |
| Immigrants | Morocco | 90.5 /100 | #115 | Exceptional 10.1% |
| Basques | 89.8 /100 | #116 | Excellent 10.1% |