Syrian vs Peruvian Unemployment Among Women with Children Ages 6 to 17 years
COMPARE
Syrian
Peruvian
Unemployment Among Women with Children Ages 6 to 17 years
Unemployment Among Women with Children Ages 6 to 17 years Comparison
Syrians
Peruvians
9.2%
UNEMPLOYMENT AMONG WOMEN WITH CHILDREN AGES 6 TO 17 YEARS
6.9/ 100
METRIC RATING
218th/ 347
METRIC RANK
9.2%
UNEMPLOYMENT AMONG WOMEN WITH CHILDREN AGES 6 TO 17 YEARS
9.0/ 100
METRIC RATING
212th/ 347
METRIC RANK
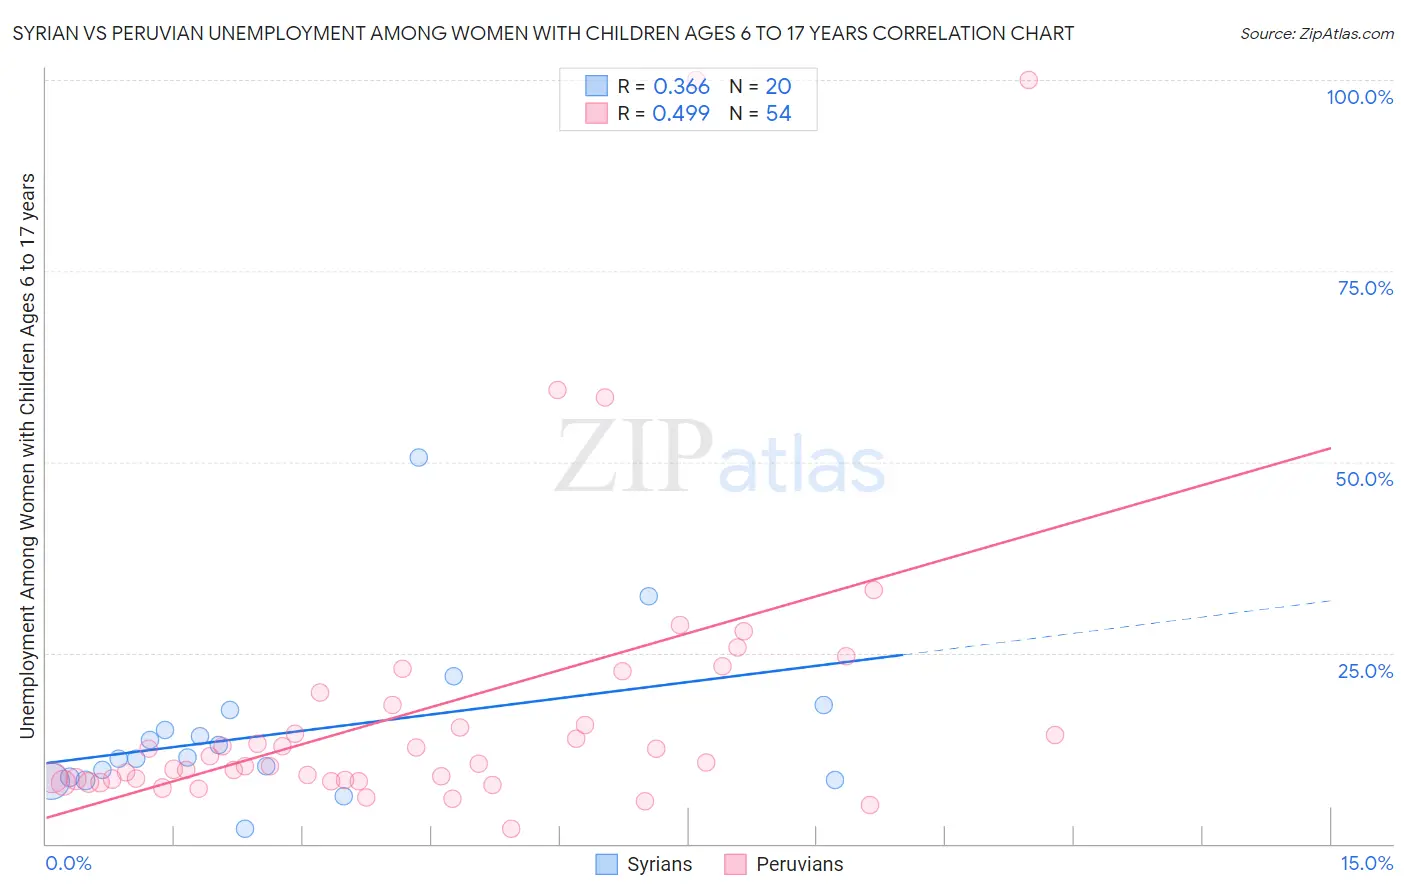
Syrian vs Peruvian Unemployment Among Women with Children Ages 6 to 17 years Correlation Chart
The statistical analysis conducted on geographies consisting of 201,815,602 people shows a mild positive correlation between the proportion of Syrians and unemployment rate among women with children between the ages 6 and 17 in the United States with a correlation coefficient (R) of 0.366 and weighted average of 9.2%. Similarly, the statistical analysis conducted on geographies consisting of 270,138,716 people shows a moderate positive correlation between the proportion of Peruvians and unemployment rate among women with children between the ages 6 and 17 in the United States with a correlation coefficient (R) of 0.499 and weighted average of 9.2%, a difference of 0.31%.
Unemployment Among Women with Children Ages 6 to 17 years Correlation Summary
| Measurement | Syrian | Peruvian |
| Minimum | 2.0% | 1.9% |
| Maximum | 50.6% | 100.0% |
| Range | 48.6% | 98.1% |
| Mean | 14.5% | 17.6% |
| Median | 11.2% | 10.6% |
| Interquartile 25% (IQ1) | 8.5% | 8.3% |
| Interquartile 75% (IQ3) | 16.2% | 18.2% |
| Interquartile Range (IQR) | 7.7% | 9.9% |
| Standard Deviation (Sample) | 10.7% | 19.7% |
| Standard Deviation (Population) | 10.4% | 19.5% |
Demographics Similar to Syrians and Peruvians by Unemployment Among Women with Children Ages 6 to 17 years
In terms of unemployment among women with children ages 6 to 17 years, the demographic groups most similar to Syrians are German (9.2%, a difference of 0.050%), Immigrants from Scotland (9.2%, a difference of 0.050%), Immigrants from Germany (9.2%, a difference of 0.060%), Immigrants from Uruguay (9.2%, a difference of 0.060%), and Belgian (9.2%, a difference of 0.080%). Similarly, the demographic groups most similar to Peruvians are Immigrants from Cuba (9.2%, a difference of 0.080%), Spaniard (9.2%, a difference of 0.11%), Finnish (9.2%, a difference of 0.13%), Iroquois (9.2%, a difference of 0.21%), and Immigrants from Peru (9.2%, a difference of 0.22%).
| Demographics | Rating | Rank | Unemployment Among Women with Children Ages 6 to 17 years |
| Immigrants | Western Europe | 14.1 /100 | #205 | Poor 9.1% |
| Immigrants | North America | 12.7 /100 | #206 | Poor 9.2% |
| Cubans | 10.9 /100 | #207 | Poor 9.2% |
| Immigrants | Peru | 10.8 /100 | #208 | Poor 9.2% |
| Salvadorans | 10.7 /100 | #209 | Poor 9.2% |
| Finns | 10.0 /100 | #210 | Tragic 9.2% |
| Immigrants | Cuba | 9.6 /100 | #211 | Tragic 9.2% |
| Peruvians | 9.0 /100 | #212 | Tragic 9.2% |
| Spaniards | 8.2 /100 | #213 | Tragic 9.2% |
| Iroquois | 7.5 /100 | #214 | Tragic 9.2% |
| Immigrants | Germany | 7.2 /100 | #215 | Tragic 9.2% |
| Immigrants | Uruguay | 7.2 /100 | #216 | Tragic 9.2% |
| Germans | 7.2 /100 | #217 | Tragic 9.2% |
| Syrians | 6.9 /100 | #218 | Tragic 9.2% |
| Immigrants | Scotland | 6.6 /100 | #219 | Tragic 9.2% |
| Belgians | 6.4 /100 | #220 | Tragic 9.2% |
| Crow | 5.8 /100 | #221 | Tragic 9.2% |
| Immigrants | Southern Europe | 5.8 /100 | #222 | Tragic 9.2% |
| Immigrants | Eritrea | 5.8 /100 | #223 | Tragic 9.2% |
| Immigrants | El Salvador | 5.3 /100 | #224 | Tragic 9.3% |
| Chinese | 5.2 /100 | #225 | Tragic 9.3% |