Syrian vs Immigrants from Afghanistan Unemployment Among Seniors over 65 years
COMPARE
Syrian
Immigrants from Afghanistan
Unemployment Among Seniors over 65 years
Unemployment Among Seniors over 65 years Comparison
Syrians
Immigrants from Afghanistan
5.1%
UNEMPLOYMENT AMONG SENIORS OVER 65 YEARS
85.3/ 100
METRIC RATING
133rd/ 347
METRIC RANK
5.1%
UNEMPLOYMENT AMONG SENIORS OVER 65 YEARS
76.8/ 100
METRIC RATING
149th/ 347
METRIC RANK
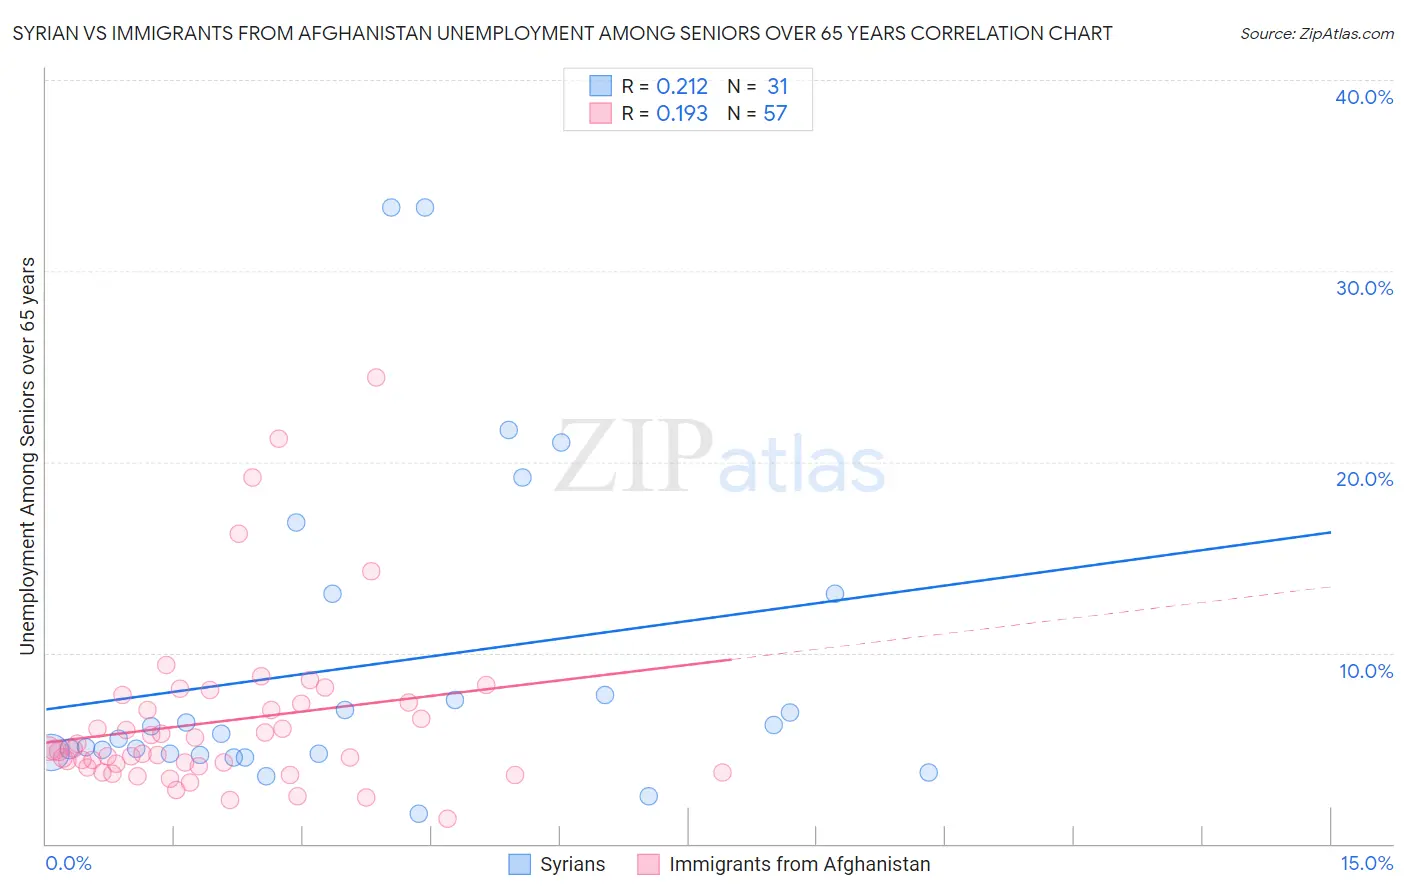
Syrian vs Immigrants from Afghanistan Unemployment Among Seniors over 65 years Correlation Chart
The statistical analysis conducted on geographies consisting of 249,290,936 people shows a weak positive correlation between the proportion of Syrians and unemployment rate amomg seniors over the age of 65 in the United States with a correlation coefficient (R) of 0.212 and weighted average of 5.1%. Similarly, the statistical analysis conducted on geographies consisting of 142,603,246 people shows a poor positive correlation between the proportion of Immigrants from Afghanistan and unemployment rate amomg seniors over the age of 65 in the United States with a correlation coefficient (R) of 0.193 and weighted average of 5.1%, a difference of 0.45%.
Unemployment Among Seniors over 65 years Correlation Summary
| Measurement | Syrian | Immigrants from Afghanistan |
| Minimum | 1.6% | 1.3% |
| Maximum | 33.3% | 24.4% |
| Range | 31.7% | 23.1% |
| Mean | 9.4% | 6.4% |
| Median | 5.8% | 4.9% |
| Interquartile 25% (IQ1) | 4.7% | 4.0% |
| Interquartile 75% (IQ3) | 13.1% | 7.3% |
| Interquartile Range (IQR) | 8.4% | 3.3% |
| Standard Deviation (Sample) | 8.3% | 4.5% |
| Standard Deviation (Population) | 8.2% | 4.4% |
Demographics Similar to Syrians and Immigrants from Afghanistan by Unemployment Among Seniors over 65 years
In terms of unemployment among seniors over 65 years, the demographic groups most similar to Syrians are Chilean (5.1%, a difference of 0.020%), Immigrants from Australia (5.1%, a difference of 0.030%), Turkish (5.1%, a difference of 0.030%), Ukrainian (5.1%, a difference of 0.050%), and White/Caucasian (5.1%, a difference of 0.060%). Similarly, the demographic groups most similar to Immigrants from Afghanistan are Greek (5.1%, a difference of 0.010%), Slovak (5.1%, a difference of 0.050%), Immigrants from Asia (5.1%, a difference of 0.050%), Pakistani (5.1%, a difference of 0.060%), and Immigrants from Russia (5.1%, a difference of 0.080%).
| Demographics | Rating | Rank | Unemployment Among Seniors over 65 years |
| Immigrants | Australia | 85.8 /100 | #131 | Excellent 5.1% |
| Chileans | 85.6 /100 | #132 | Excellent 5.1% |
| Syrians | 85.3 /100 | #133 | Excellent 5.1% |
| Turks | 84.9 /100 | #134 | Excellent 5.1% |
| Ukrainians | 84.4 /100 | #135 | Excellent 5.1% |
| Whites/Caucasians | 84.4 /100 | #136 | Excellent 5.1% |
| Arabs | 84.3 /100 | #137 | Excellent 5.1% |
| New Zealanders | 83.2 /100 | #138 | Excellent 5.1% |
| Immigrants | Panama | 83.0 /100 | #139 | Excellent 5.1% |
| Immigrants | Chile | 83.0 /100 | #140 | Excellent 5.1% |
| Cherokee | 81.6 /100 | #141 | Excellent 5.1% |
| Immigrants | Indonesia | 81.0 /100 | #142 | Excellent 5.1% |
| Senegalese | 80.4 /100 | #143 | Excellent 5.1% |
| Poles | 80.3 /100 | #144 | Excellent 5.1% |
| Spanish | 78.8 /100 | #145 | Good 5.1% |
| Immigrants | Russia | 78.5 /100 | #146 | Good 5.1% |
| Slovaks | 77.9 /100 | #147 | Good 5.1% |
| Greeks | 77.0 /100 | #148 | Good 5.1% |
| Immigrants | Afghanistan | 76.8 /100 | #149 | Good 5.1% |
| Immigrants | Asia | 75.6 /100 | #150 | Good 5.1% |
| Pakistanis | 75.5 /100 | #151 | Good 5.1% |