Swiss vs Hungarian Unemployment Among Ages 60 to 64 years
COMPARE
Swiss
Hungarian
Unemployment Among Ages 60 to 64 years
Unemployment Among Ages 60 to 64 years Comparison
Swiss
Hungarians
4.6%
UNEMPLOYMENT AMONG AGES 60 TO 64 YEARS
99.8/ 100
METRIC RATING
59th/ 347
METRIC RANK
4.9%
UNEMPLOYMENT AMONG AGES 60 TO 64 YEARS
40.6/ 100
METRIC RATING
181st/ 347
METRIC RANK
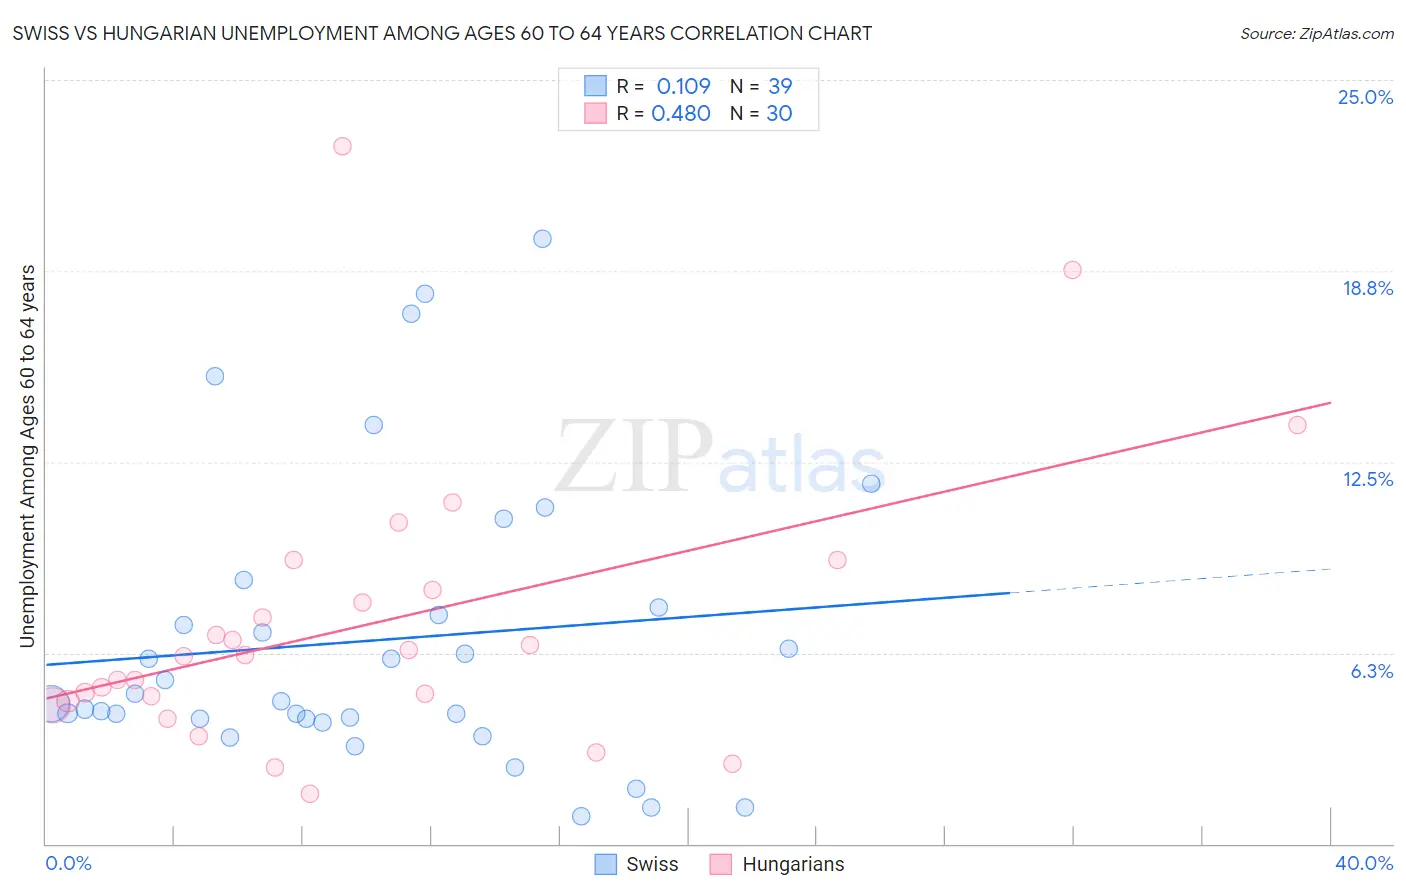
Swiss vs Hungarian Unemployment Among Ages 60 to 64 years Correlation Chart
The statistical analysis conducted on geographies consisting of 401,314,393 people shows a poor positive correlation between the proportion of Swiss and unemployment rate among population between the ages 60 and 64 in the United States with a correlation coefficient (R) of 0.109 and weighted average of 4.6%. Similarly, the statistical analysis conducted on geographies consisting of 421,292,514 people shows a moderate positive correlation between the proportion of Hungarians and unemployment rate among population between the ages 60 and 64 in the United States with a correlation coefficient (R) of 0.480 and weighted average of 4.9%, a difference of 6.3%.
Unemployment Among Ages 60 to 64 years Correlation Summary
| Measurement | Swiss | Hungarian |
| Minimum | 0.90% | 1.7% |
| Maximum | 19.8% | 22.8% |
| Range | 18.9% | 21.2% |
| Mean | 6.7% | 7.2% |
| Median | 4.7% | 6.1% |
| Interquartile 25% (IQ1) | 4.1% | 4.7% |
| Interquartile 75% (IQ3) | 7.7% | 8.3% |
| Interquartile Range (IQR) | 3.6% | 3.6% |
| Standard Deviation (Sample) | 4.7% | 4.6% |
| Standard Deviation (Population) | 4.7% | 4.5% |
Similar Demographics by Unemployment Among Ages 60 to 64 years
Demographics Similar to Swiss by Unemployment Among Ages 60 to 64 years
In terms of unemployment among ages 60 to 64 years, the demographic groups most similar to Swiss are Puget Sound Salish (4.6%, a difference of 0.020%), Immigrants from India (4.6%, a difference of 0.10%), British (4.6%, a difference of 0.15%), Welsh (4.6%, a difference of 0.16%), and Bangladeshi (4.6%, a difference of 0.25%).
| Demographics | Rating | Rank | Unemployment Among Ages 60 to 64 years |
| Kenyans | 99.9 /100 | #52 | Exceptional 4.6% |
| Immigrants | Moldova | 99.9 /100 | #53 | Exceptional 4.6% |
| Dutch | 99.9 /100 | #54 | Exceptional 4.6% |
| Bangladeshis | 99.9 /100 | #55 | Exceptional 4.6% |
| Welsh | 99.9 /100 | #56 | Exceptional 4.6% |
| British | 99.9 /100 | #57 | Exceptional 4.6% |
| Immigrants | India | 99.8 /100 | #58 | Exceptional 4.6% |
| Swiss | 99.8 /100 | #59 | Exceptional 4.6% |
| Puget Sound Salish | 99.8 /100 | #60 | Exceptional 4.6% |
| Lebanese | 99.8 /100 | #61 | Exceptional 4.6% |
| Senegalese | 99.7 /100 | #62 | Exceptional 4.6% |
| Czechoslovakians | 99.7 /100 | #63 | Exceptional 4.6% |
| Immigrants | Middle Africa | 99.7 /100 | #64 | Exceptional 4.6% |
| Jordanians | 99.7 /100 | #65 | Exceptional 4.6% |
| Hawaiians | 99.6 /100 | #66 | Exceptional 4.6% |
Demographics Similar to Hungarians by Unemployment Among Ages 60 to 64 years
In terms of unemployment among ages 60 to 64 years, the demographic groups most similar to Hungarians are Asian (4.9%, a difference of 0.0%), Sri Lankan (4.9%, a difference of 0.030%), Subsaharan African (4.9%, a difference of 0.070%), Immigrants from Ukraine (4.9%, a difference of 0.11%), and Ute (4.9%, a difference of 0.12%).
| Demographics | Rating | Rank | Unemployment Among Ages 60 to 64 years |
| Immigrants | Western Europe | 50.0 /100 | #174 | Average 4.9% |
| Immigrants | Latvia | 46.9 /100 | #175 | Average 4.9% |
| Bermudans | 46.5 /100 | #176 | Average 4.9% |
| Immigrants | Malaysia | 44.7 /100 | #177 | Average 4.9% |
| Immigrants | Nonimmigrants | 44.5 /100 | #178 | Average 4.9% |
| Immigrants | Sweden | 44.3 /100 | #179 | Average 4.9% |
| Asians | 40.8 /100 | #180 | Average 4.9% |
| Hungarians | 40.6 /100 | #181 | Average 4.9% |
| Sri Lankans | 39.8 /100 | #182 | Fair 4.9% |
| Sub-Saharan Africans | 38.9 /100 | #183 | Fair 4.9% |
| Immigrants | Ukraine | 37.6 /100 | #184 | Fair 4.9% |
| Ute | 37.4 /100 | #185 | Fair 4.9% |
| Spaniards | 35.8 /100 | #186 | Fair 4.9% |
| South American Indians | 31.2 /100 | #187 | Fair 4.9% |
| Nicaraguans | 30.4 /100 | #188 | Fair 4.9% |