Swiss vs Immigrants from India Unemployment Among Ages 16 to 19 years
COMPARE
Swiss
Immigrants from India
Unemployment Among Ages 16 to 19 years
Unemployment Among Ages 16 to 19 years Comparison
Swiss
Immigrants from India
15.8%
UNEMPLOYMENT AMONG AGES 16 TO 19 YEARS
100.0/ 100
METRIC RATING
19th/ 347
METRIC RANK
15.0%
UNEMPLOYMENT AMONG AGES 16 TO 19 YEARS
100.0/ 100
METRIC RATING
2nd/ 347
METRIC RANK
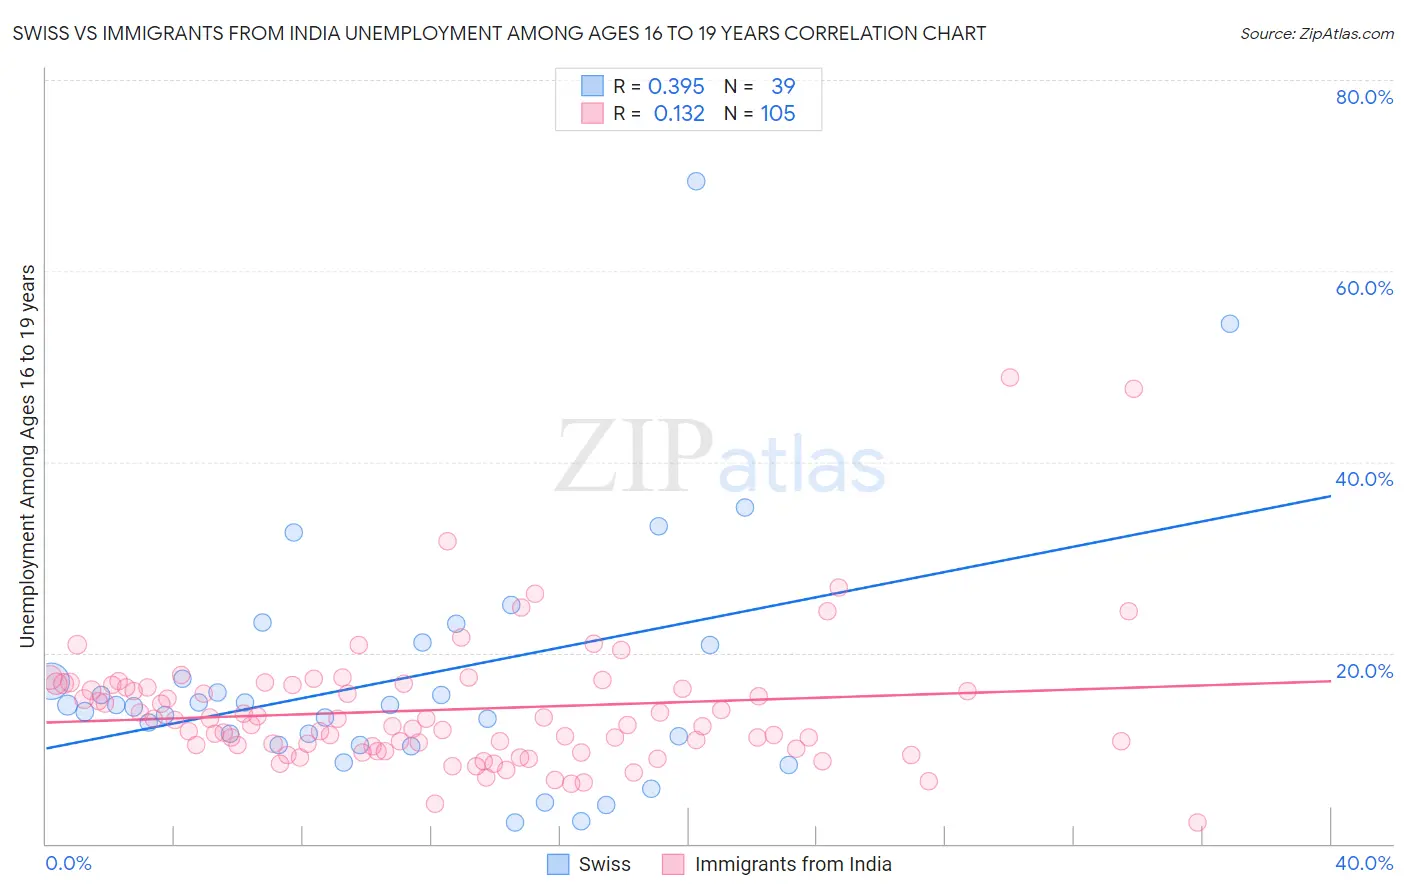
Swiss vs Immigrants from India Unemployment Among Ages 16 to 19 years Correlation Chart
The statistical analysis conducted on geographies consisting of 429,339,999 people shows a mild positive correlation between the proportion of Swiss and unemployment rate among population between the ages 16 and 19 in the United States with a correlation coefficient (R) of 0.395 and weighted average of 15.8%. Similarly, the statistical analysis conducted on geographies consisting of 409,890,327 people shows a poor positive correlation between the proportion of Immigrants from India and unemployment rate among population between the ages 16 and 19 in the United States with a correlation coefficient (R) of 0.132 and weighted average of 15.0%, a difference of 5.0%.
Unemployment Among Ages 16 to 19 years Correlation Summary
| Measurement | Swiss | Immigrants from India |
| Minimum | 2.2% | 2.2% |
| Maximum | 69.4% | 48.9% |
| Range | 67.2% | 46.7% |
| Mean | 17.3% | 14.0% |
| Median | 14.5% | 12.4% |
| Interquartile 25% (IQ1) | 10.3% | 10.0% |
| Interquartile 75% (IQ3) | 20.8% | 16.6% |
| Interquartile Range (IQR) | 10.5% | 6.6% |
| Standard Deviation (Sample) | 13.1% | 6.9% |
| Standard Deviation (Population) | 12.9% | 6.9% |
Demographics Similar to Swiss and Immigrants from India by Unemployment Among Ages 16 to 19 years
In terms of unemployment among ages 16 to 19 years, the demographic groups most similar to Swiss are Sudanese (15.8%, a difference of 0.10%), Thai (15.7%, a difference of 0.11%), Somali (15.7%, a difference of 0.35%), German (15.7%, a difference of 0.56%), and Yugoslavian (15.6%, a difference of 0.85%). Similarly, the demographic groups most similar to Immigrants from India are Luxembourger (15.1%, a difference of 0.42%), Danish (15.2%, a difference of 1.2%), Immigrants from Somalia (15.3%, a difference of 1.8%), Swedish (15.3%, a difference of 2.1%), and Immigrants from Bosnia and Herzegovina (15.3%, a difference of 2.2%).
| Demographics | Rating | Rank | Unemployment Among Ages 16 to 19 years |
| Norwegians | 100.0 /100 | #1 | Exceptional 14.5% |
| Immigrants | India | 100.0 /100 | #2 | Exceptional 15.0% |
| Luxembourgers | 100.0 /100 | #3 | Exceptional 15.1% |
| Danes | 100.0 /100 | #4 | Exceptional 15.2% |
| Immigrants | Somalia | 100.0 /100 | #5 | Exceptional 15.3% |
| Swedes | 100.0 /100 | #6 | Exceptional 15.3% |
| Immigrants | Bosnia and Herzegovina | 100.0 /100 | #7 | Exceptional 15.3% |
| Czechs | 100.0 /100 | #8 | Exceptional 15.4% |
| Scandinavians | 100.0 /100 | #9 | Exceptional 15.4% |
| Zimbabweans | 100.0 /100 | #10 | Exceptional 15.4% |
| Indonesians | 100.0 /100 | #11 | Exceptional 15.5% |
| Taiwanese | 100.0 /100 | #12 | Exceptional 15.5% |
| Immigrants | Burma/Myanmar | 100.0 /100 | #13 | Exceptional 15.6% |
| Immigrants | Zaire | 100.0 /100 | #14 | Exceptional 15.6% |
| Yugoslavians | 100.0 /100 | #15 | Exceptional 15.6% |
| Germans | 100.0 /100 | #16 | Exceptional 15.7% |
| Somalis | 100.0 /100 | #17 | Exceptional 15.7% |
| Thais | 100.0 /100 | #18 | Exceptional 15.7% |
| Swiss | 100.0 /100 | #19 | Exceptional 15.8% |
| Sudanese | 100.0 /100 | #20 | Exceptional 15.8% |