Immigrants from Latvia vs Immigrants from Belize Unemployment Among Ages 16 to 19 years
COMPARE
Immigrants from Latvia
Immigrants from Belize
Unemployment Among Ages 16 to 19 years
Unemployment Among Ages 16 to 19 years Comparison
Immigrants from Latvia
Immigrants from Belize
16.8%
UNEMPLOYMENT AMONG AGES 16 TO 19 YEARS
97.5/ 100
METRIC RATING
81st/ 347
METRIC RANK
22.2%
UNEMPLOYMENT AMONG AGES 16 TO 19 YEARS
0.0/ 100
METRIC RATING
317th/ 347
METRIC RANK
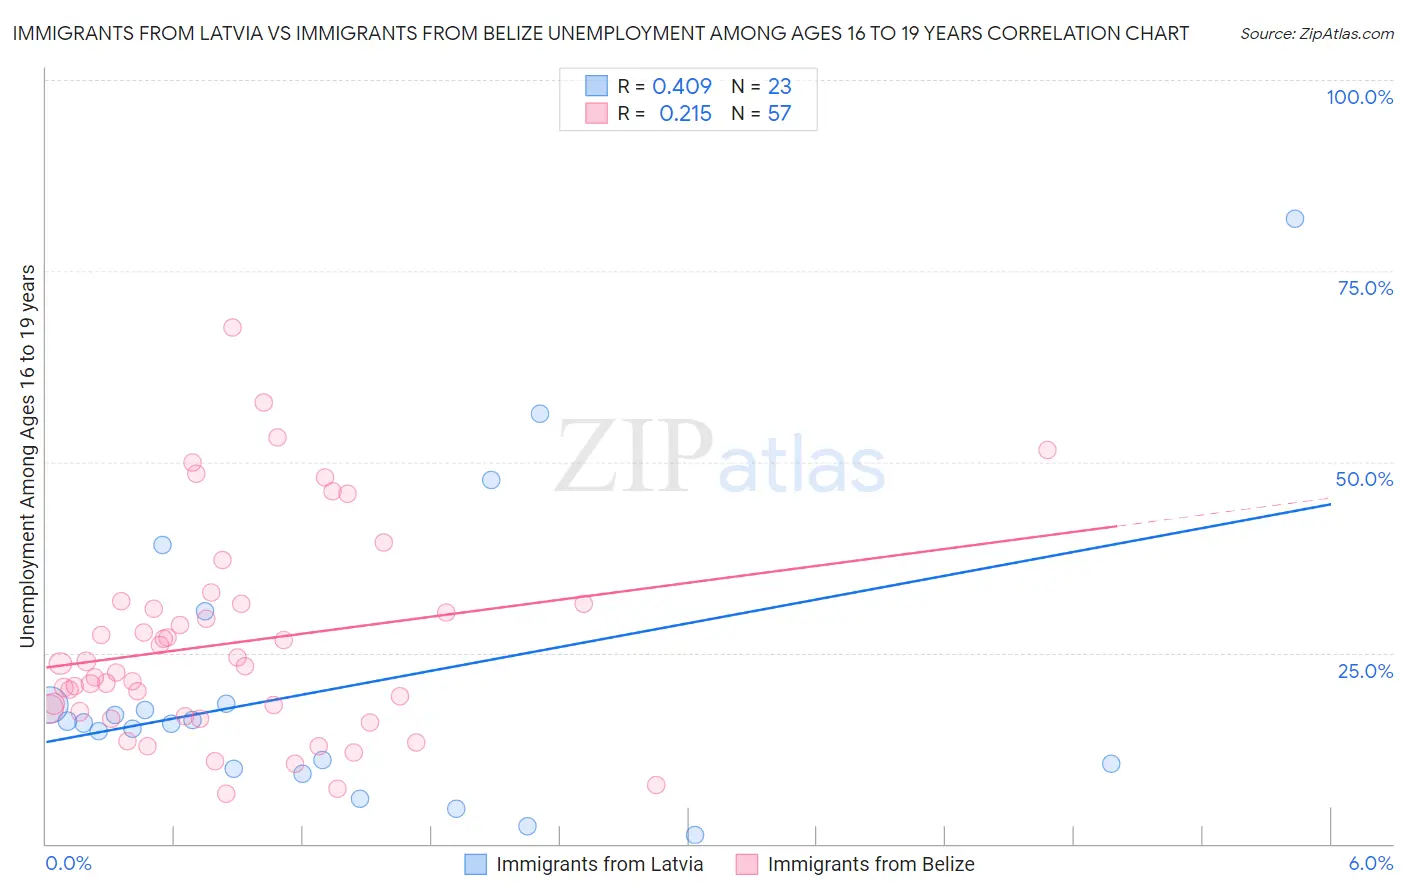
Immigrants from Latvia vs Immigrants from Belize Unemployment Among Ages 16 to 19 years Correlation Chart
The statistical analysis conducted on geographies consisting of 111,162,820 people shows a moderate positive correlation between the proportion of Immigrants from Latvia and unemployment rate among population between the ages 16 and 19 in the United States with a correlation coefficient (R) of 0.409 and weighted average of 16.8%. Similarly, the statistical analysis conducted on geographies consisting of 128,436,960 people shows a weak positive correlation between the proportion of Immigrants from Belize and unemployment rate among population between the ages 16 and 19 in the United States with a correlation coefficient (R) of 0.215 and weighted average of 22.2%, a difference of 31.8%.
Unemployment Among Ages 16 to 19 years Correlation Summary
| Measurement | Immigrants from Latvia | Immigrants from Belize |
| Minimum | 1.1% | 6.5% |
| Maximum | 81.8% | 67.6% |
| Range | 80.7% | 61.1% |
| Mean | 20.6% | 26.3% |
| Median | 15.8% | 23.3% |
| Interquartile 25% (IQ1) | 9.8% | 17.0% |
| Interquartile 75% (IQ3) | 18.4% | 31.5% |
| Interquartile Range (IQR) | 8.6% | 14.5% |
| Standard Deviation (Sample) | 19.1% | 13.6% |
| Standard Deviation (Population) | 18.7% | 13.5% |
Similar Demographics by Unemployment Among Ages 16 to 19 years
Demographics Similar to Immigrants from Latvia by Unemployment Among Ages 16 to 19 years
In terms of unemployment among ages 16 to 19 years, the demographic groups most similar to Immigrants from Latvia are Slovak (16.8%, a difference of 0.0%), French Canadian (16.8%, a difference of 0.0%), White/Caucasian (16.8%, a difference of 0.010%), Ugandan (16.8%, a difference of 0.020%), and French (16.8%, a difference of 0.060%).
| Demographics | Rating | Rank | Unemployment Among Ages 16 to 19 years |
| Immigrants | Eastern Africa | 98.1 /100 | #74 | Exceptional 16.8% |
| New Zealanders | 98.0 /100 | #75 | Exceptional 16.8% |
| Immigrants | North America | 97.9 /100 | #76 | Exceptional 16.8% |
| Immigrants | Singapore | 97.8 /100 | #77 | Exceptional 16.8% |
| Soviet Union | 97.8 /100 | #78 | Exceptional 16.8% |
| Slovaks | 97.5 /100 | #79 | Exceptional 16.8% |
| French Canadians | 97.5 /100 | #80 | Exceptional 16.8% |
| Immigrants | Latvia | 97.5 /100 | #81 | Exceptional 16.8% |
| Whites/Caucasians | 97.5 /100 | #82 | Exceptional 16.8% |
| Ugandans | 97.4 /100 | #83 | Exceptional 16.8% |
| French | 97.4 /100 | #84 | Exceptional 16.8% |
| Immigrants | Kuwait | 97.2 /100 | #85 | Exceptional 16.8% |
| Immigrants | Scotland | 97.2 /100 | #86 | Exceptional 16.8% |
| Greeks | 97.0 /100 | #87 | Exceptional 16.9% |
| Immigrants | South Africa | 96.9 /100 | #88 | Exceptional 16.9% |
Demographics Similar to Immigrants from Belize by Unemployment Among Ages 16 to 19 years
In terms of unemployment among ages 16 to 19 years, the demographic groups most similar to Immigrants from Belize are Immigrants from Jamaica (22.2%, a difference of 0.15%), Immigrants from West Indies (22.2%, a difference of 0.31%), Tohono O'odham (22.1%, a difference of 0.45%), Cheyenne (22.3%, a difference of 0.54%), and Immigrants from Dominica (21.9%, a difference of 0.99%).
| Demographics | Rating | Rank | Unemployment Among Ages 16 to 19 years |
| Vietnamese | 0.0 /100 | #310 | Tragic 21.5% |
| Belizeans | 0.0 /100 | #311 | Tragic 21.6% |
| Houma | 0.0 /100 | #312 | Tragic 21.6% |
| Jamaicans | 0.0 /100 | #313 | Tragic 21.7% |
| Alaska Natives | 0.0 /100 | #314 | Tragic 21.8% |
| Immigrants | Dominica | 0.0 /100 | #315 | Tragic 21.9% |
| Tohono O'odham | 0.0 /100 | #316 | Tragic 22.1% |
| Immigrants | Belize | 0.0 /100 | #317 | Tragic 22.2% |
| Immigrants | Jamaica | 0.0 /100 | #318 | Tragic 22.2% |
| Immigrants | West Indies | 0.0 /100 | #319 | Tragic 22.2% |
| Cheyenne | 0.0 /100 | #320 | Tragic 22.3% |
| West Indians | 0.0 /100 | #321 | Tragic 22.4% |
| Barbadians | 0.0 /100 | #322 | Tragic 22.5% |
| Yakama | 0.0 /100 | #323 | Tragic 22.5% |
| Immigrants | Armenia | 0.0 /100 | #324 | Tragic 22.6% |