Immigrants from Europe vs Latvian Unemployment Among Women with Children Under 6 years
COMPARE
Immigrants from Europe
Latvian
Unemployment Among Women with Children Under 6 years
Unemployment Among Women with Children Under 6 years Comparison
Immigrants from Europe
Latvians
7.2%
UNEMPLOYMENT AMONG WOMEN WITH CHILDREN UNDER 6 YEARS
97.5/ 100
METRIC RATING
99th/ 347
METRIC RANK
6.8%
UNEMPLOYMENT AMONG WOMEN WITH CHILDREN UNDER 6 YEARS
99.9/ 100
METRIC RATING
46th/ 347
METRIC RANK
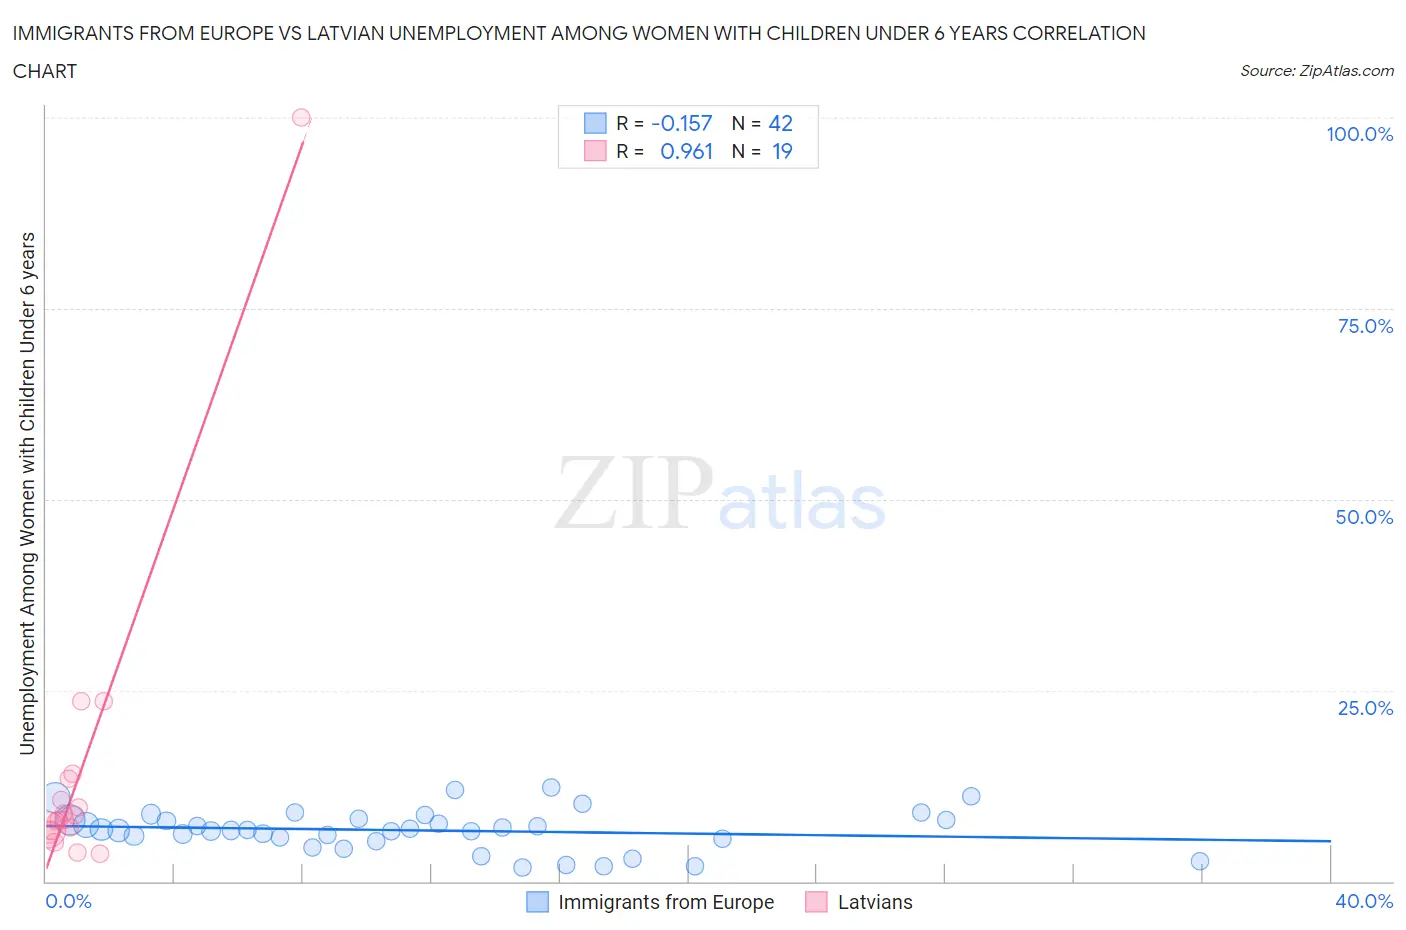
Immigrants from Europe vs Latvian Unemployment Among Women with Children Under 6 years Correlation Chart
The statistical analysis conducted on geographies consisting of 372,239,428 people shows a poor negative correlation between the proportion of Immigrants from Europe and unemployment rate among women with children under the age of 6 in the United States with a correlation coefficient (R) of -0.157 and weighted average of 7.2%. Similarly, the statistical analysis conducted on geographies consisting of 177,379,958 people shows a perfect positive correlation between the proportion of Latvians and unemployment rate among women with children under the age of 6 in the United States with a correlation coefficient (R) of 0.961 and weighted average of 6.8%, a difference of 6.1%.
Unemployment Among Women with Children Under 6 years Correlation Summary
| Measurement | Immigrants from Europe | Latvian |
| Minimum | 1.8% | 3.6% |
| Maximum | 12.2% | 100.0% |
| Range | 10.4% | 96.4% |
| Mean | 6.7% | 14.5% |
| Median | 6.7% | 8.0% |
| Interquartile 25% (IQ1) | 5.6% | 6.7% |
| Interquartile 75% (IQ3) | 8.1% | 13.4% |
| Interquartile Range (IQR) | 2.5% | 6.7% |
| Standard Deviation (Sample) | 2.6% | 21.4% |
| Standard Deviation (Population) | 2.6% | 20.9% |
Similar Demographics by Unemployment Among Women with Children Under 6 years
Demographics Similar to Immigrants from Europe by Unemployment Among Women with Children Under 6 years
In terms of unemployment among women with children under 6 years, the demographic groups most similar to Immigrants from Europe are Russian (7.2%, a difference of 0.040%), Immigrants from Northern Europe (7.2%, a difference of 0.040%), Immigrants from South Eastern Asia (7.2%, a difference of 0.070%), Chilean (7.2%, a difference of 0.070%), and Immigrants from Nicaragua (7.2%, a difference of 0.10%).
| Demographics | Rating | Rank | Unemployment Among Women with Children Under 6 years |
| Albanians | 98.0 /100 | #92 | Exceptional 7.2% |
| New Zealanders | 97.8 /100 | #93 | Exceptional 7.2% |
| Macedonians | 97.7 /100 | #94 | Exceptional 7.2% |
| Romanians | 97.7 /100 | #95 | Exceptional 7.2% |
| Immigrants | Eastern Africa | 97.7 /100 | #96 | Exceptional 7.2% |
| Immigrants | South Eastern Asia | 97.6 /100 | #97 | Exceptional 7.2% |
| Russians | 97.5 /100 | #98 | Exceptional 7.2% |
| Immigrants | Europe | 97.5 /100 | #99 | Exceptional 7.2% |
| Immigrants | Northern Europe | 97.4 /100 | #100 | Exceptional 7.2% |
| Chileans | 97.4 /100 | #101 | Exceptional 7.2% |
| Immigrants | Nicaragua | 97.3 /100 | #102 | Exceptional 7.2% |
| Immigrants | Saudi Arabia | 97.3 /100 | #103 | Exceptional 7.2% |
| Immigrants | Egypt | 97.2 /100 | #104 | Exceptional 7.2% |
| Venezuelans | 97.2 /100 | #105 | Exceptional 7.2% |
| Immigrants | Pakistan | 97.2 /100 | #106 | Exceptional 7.2% |
Demographics Similar to Latvians by Unemployment Among Women with Children Under 6 years
In terms of unemployment among women with children under 6 years, the demographic groups most similar to Latvians are Immigrants from Asia (6.8%, a difference of 0.17%), Immigrants from Switzerland (6.8%, a difference of 0.20%), Immigrants from Australia (6.8%, a difference of 0.24%), Immigrants from Nepal (6.8%, a difference of 0.26%), and Immigrants from Ireland (6.8%, a difference of 0.26%).
| Demographics | Rating | Rank | Unemployment Among Women with Children Under 6 years |
| Immigrants | Russia | 100.0 /100 | #39 | Exceptional 6.7% |
| Asians | 100.0 /100 | #40 | Exceptional 6.7% |
| Immigrants | Indonesia | 99.9 /100 | #41 | Exceptional 6.7% |
| Immigrants | Cuba | 99.9 /100 | #42 | Exceptional 6.7% |
| Bhutanese | 99.9 /100 | #43 | Exceptional 6.7% |
| Iranians | 99.9 /100 | #44 | Exceptional 6.7% |
| Immigrants | Australia | 99.9 /100 | #45 | Exceptional 6.8% |
| Latvians | 99.9 /100 | #46 | Exceptional 6.8% |
| Immigrants | Asia | 99.9 /100 | #47 | Exceptional 6.8% |
| Immigrants | Switzerland | 99.9 /100 | #48 | Exceptional 6.8% |
| Immigrants | Nepal | 99.9 /100 | #49 | Exceptional 6.8% |
| Immigrants | Ireland | 99.9 /100 | #50 | Exceptional 6.8% |
| Ethiopians | 99.9 /100 | #51 | Exceptional 6.8% |
| Immigrants | Iran | 99.9 /100 | #52 | Exceptional 6.8% |
| Chinese | 99.9 /100 | #53 | Exceptional 6.8% |