Slovak vs Immigrants from Cabo Verde Female Unemployment
COMPARE
Slovak
Immigrants from Cabo Verde
Female Unemployment
Female Unemployment Comparison
Slovaks
Immigrants from Cabo Verde
4.8%
FEMALE UNEMPLOYMENT
99.8/ 100
METRIC RATING
32nd/ 347
METRIC RANK
6.1%
FEMALE UNEMPLOYMENT
0.0/ 100
METRIC RATING
285th/ 347
METRIC RANK
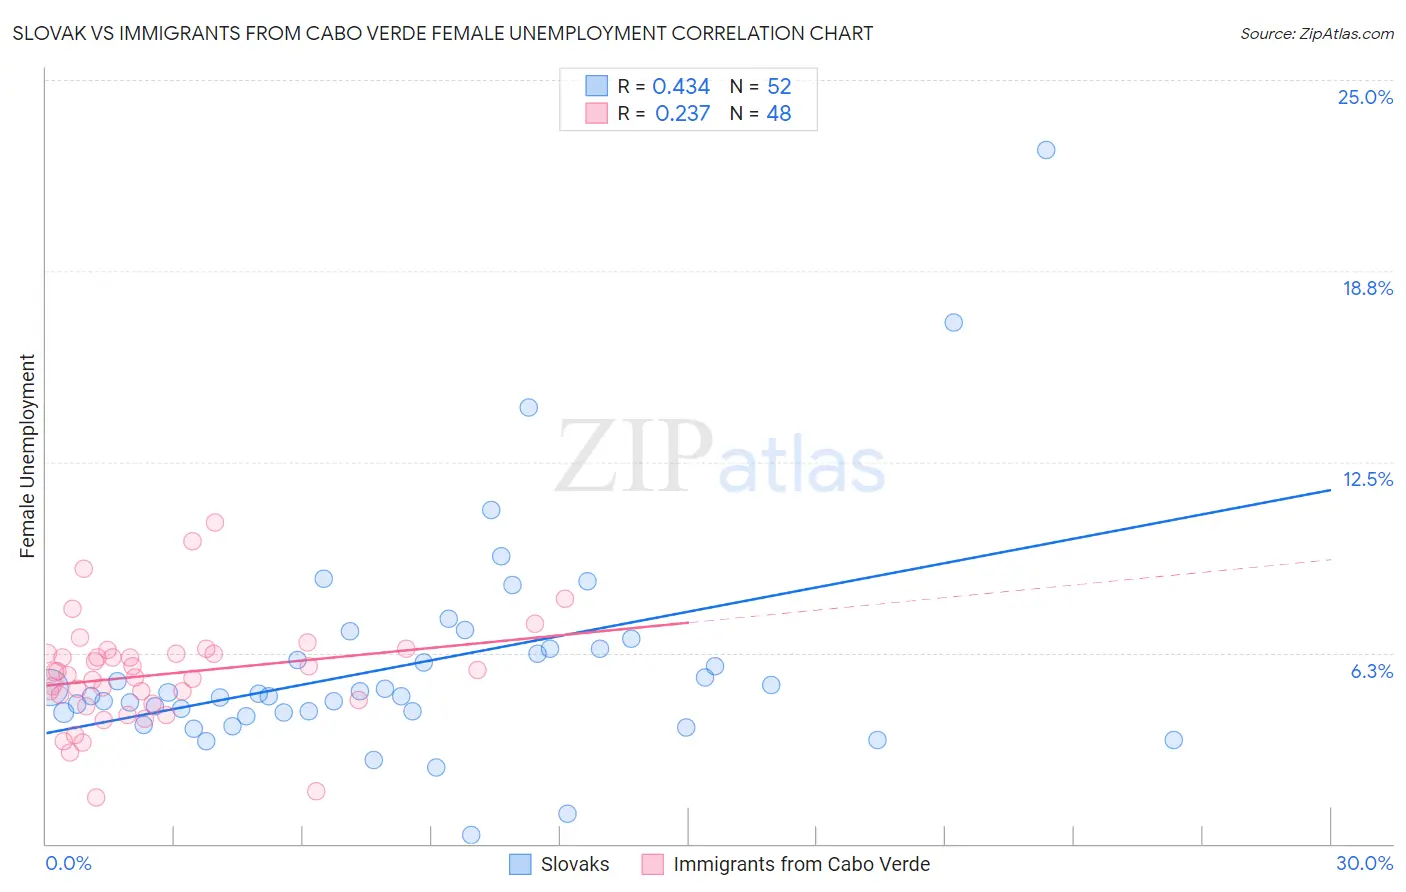
Slovak vs Immigrants from Cabo Verde Female Unemployment Correlation Chart
The statistical analysis conducted on geographies consisting of 394,798,078 people shows a moderate positive correlation between the proportion of Slovaks and unemploymnet rate among females in the United States with a correlation coefficient (R) of 0.434 and weighted average of 4.8%. Similarly, the statistical analysis conducted on geographies consisting of 38,081,993 people shows a weak positive correlation between the proportion of Immigrants from Cabo Verde and unemploymnet rate among females in the United States with a correlation coefficient (R) of 0.237 and weighted average of 6.1%, a difference of 27.7%.
Female Unemployment Correlation Summary
| Measurement | Slovak | Immigrants from Cabo Verde |
| Minimum | 0.30% | 1.5% |
| Maximum | 22.7% | 10.5% |
| Range | 22.4% | 9.0% |
| Mean | 5.9% | 5.5% |
| Median | 4.9% | 5.6% |
| Interquartile 25% (IQ1) | 4.3% | 4.7% |
| Interquartile 75% (IQ3) | 6.4% | 6.2% |
| Interquartile Range (IQR) | 2.1% | 1.6% |
| Standard Deviation (Sample) | 3.7% | 1.7% |
| Standard Deviation (Population) | 3.6% | 1.7% |
Similar Demographics by Female Unemployment
Demographics Similar to Slovaks by Female Unemployment
In terms of female unemployment, the demographic groups most similar to Slovaks are Sudanese (4.8%, a difference of 0.14%), Lithuanian (4.7%, a difference of 0.42%), Czechoslovakian (4.8%, a difference of 0.51%), Cypriot (4.7%, a difference of 0.54%), and Zimbabwean (4.8%, a difference of 0.54%).
| Demographics | Rating | Rank | Female Unemployment |
| Immigrants | India | 99.9 /100 | #25 | Exceptional 4.7% |
| Immigrants | Bosnia and Herzegovina | 99.9 /100 | #26 | Exceptional 4.7% |
| British | 99.9 /100 | #27 | Exceptional 4.7% |
| Irish | 99.9 /100 | #28 | Exceptional 4.7% |
| Cypriots | 99.9 /100 | #29 | Exceptional 4.7% |
| Lithuanians | 99.8 /100 | #30 | Exceptional 4.7% |
| Sudanese | 99.8 /100 | #31 | Exceptional 4.8% |
| Slovaks | 99.8 /100 | #32 | Exceptional 4.8% |
| Czechoslovakians | 99.7 /100 | #33 | Exceptional 4.8% |
| Zimbabweans | 99.7 /100 | #34 | Exceptional 4.8% |
| French Canadians | 99.7 /100 | #35 | Exceptional 4.8% |
| Yugoslavians | 99.7 /100 | #36 | Exceptional 4.8% |
| Pennsylvania Germans | 99.6 /100 | #37 | Exceptional 4.8% |
| Northern Europeans | 99.6 /100 | #38 | Exceptional 4.8% |
| Scotch-Irish | 99.6 /100 | #39 | Exceptional 4.8% |
Demographics Similar to Immigrants from Cabo Verde by Female Unemployment
In terms of female unemployment, the demographic groups most similar to Immigrants from Cabo Verde are Chippewa (6.1%, a difference of 0.030%), Immigrants from Guatemala (6.1%, a difference of 0.050%), Haitian (6.1%, a difference of 0.10%), Trinidadian and Tobagonian (6.1%, a difference of 0.11%), and Immigrants from Caribbean (6.1%, a difference of 0.17%).
| Demographics | Rating | Rank | Female Unemployment |
| Yaqui | 0.0 /100 | #278 | Tragic 6.0% |
| Armenians | 0.0 /100 | #279 | Tragic 6.0% |
| Mexican American Indians | 0.0 /100 | #280 | Tragic 6.0% |
| Guatemalans | 0.0 /100 | #281 | Tragic 6.0% |
| Colville | 0.0 /100 | #282 | Tragic 6.0% |
| Salvadorans | 0.0 /100 | #283 | Tragic 6.0% |
| Immigrants | Senegal | 0.0 /100 | #284 | Tragic 6.1% |
| Immigrants | Cabo Verde | 0.0 /100 | #285 | Tragic 6.1% |
| Chippewa | 0.0 /100 | #286 | Tragic 6.1% |
| Immigrants | Guatemala | 0.0 /100 | #287 | Tragic 6.1% |
| Haitians | 0.0 /100 | #288 | Tragic 6.1% |
| Trinidadians and Tobagonians | 0.0 /100 | #289 | Tragic 6.1% |
| Immigrants | Caribbean | 0.0 /100 | #290 | Tragic 6.1% |
| Immigrants | West Indies | 0.0 /100 | #291 | Tragic 6.1% |
| Immigrants | Trinidad and Tobago | 0.0 /100 | #292 | Tragic 6.1% |