French Canadian vs Seminole Male Unemployment
COMPARE
French Canadian
Seminole
Male Unemployment
Male Unemployment Comparison
French Canadians
Seminole
5.1%
MALE UNEMPLOYMENT
88.6/ 100
METRIC RATING
119th/ 347
METRIC RANK
5.6%
MALE UNEMPLOYMENT
1.8/ 100
METRIC RATING
228th/ 347
METRIC RANK
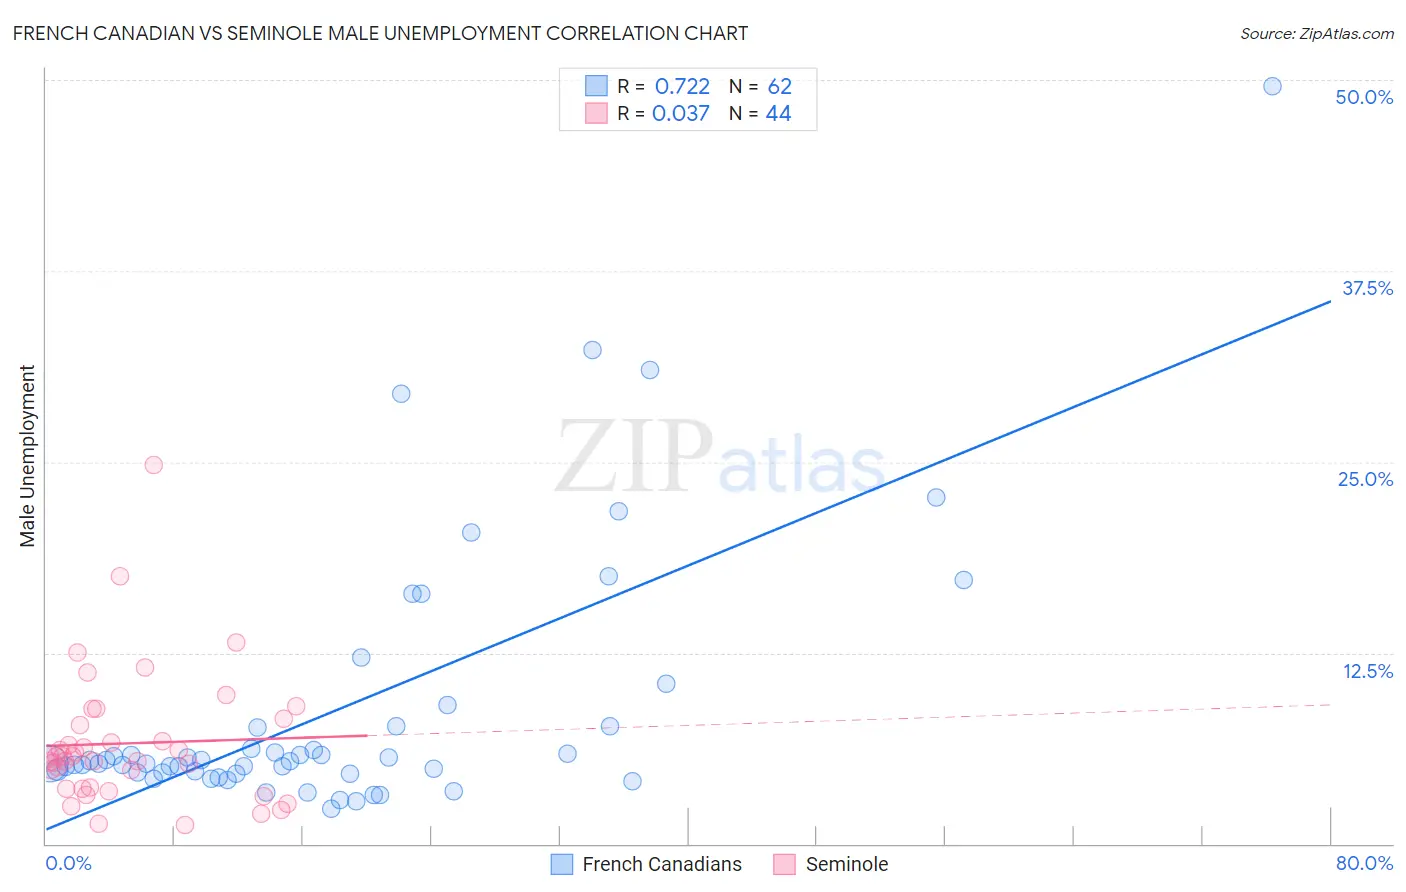
French Canadian vs Seminole Male Unemployment Correlation Chart
The statistical analysis conducted on geographies consisting of 497,036,739 people shows a strong positive correlation between the proportion of French Canadians and unemployment rate among males in the United States with a correlation coefficient (R) of 0.722 and weighted average of 5.1%. Similarly, the statistical analysis conducted on geographies consisting of 118,187,100 people shows no correlation between the proportion of Seminole and unemployment rate among males in the United States with a correlation coefficient (R) of 0.037 and weighted average of 5.6%, a difference of 9.1%.
Male Unemployment Correlation Summary
| Measurement | French Canadian | Seminole |
| Minimum | 2.3% | 1.2% |
| Maximum | 49.6% | 24.8% |
| Range | 47.3% | 23.6% |
| Mean | 8.8% | 6.6% |
| Median | 5.3% | 5.7% |
| Interquartile 25% (IQ1) | 4.7% | 3.7% |
| Interquartile 75% (IQ3) | 7.7% | 8.0% |
| Interquartile Range (IQR) | 3.0% | 4.3% |
| Standard Deviation (Sample) | 8.8% | 4.4% |
| Standard Deviation (Population) | 8.7% | 4.3% |
Similar Demographics by Male Unemployment
Demographics Similar to French Canadians by Male Unemployment
In terms of male unemployment, the demographic groups most similar to French Canadians are Ukrainian (5.1%, a difference of 0.020%), Mongolian (5.1%, a difference of 0.030%), Cypriot (5.1%, a difference of 0.040%), Nicaraguan (5.1%, a difference of 0.060%), and Estonian (5.1%, a difference of 0.070%).
| Demographics | Rating | Rank | Male Unemployment |
| Immigrants | Moldova | 90.3 /100 | #112 | Exceptional 5.1% |
| Immigrants | Austria | 90.3 /100 | #113 | Exceptional 5.1% |
| Romanians | 89.8 /100 | #114 | Excellent 5.1% |
| Immigrants | Asia | 89.6 /100 | #115 | Excellent 5.1% |
| Immigrants | Denmark | 89.4 /100 | #116 | Excellent 5.1% |
| Estonians | 89.0 /100 | #117 | Excellent 5.1% |
| Cypriots | 88.8 /100 | #118 | Excellent 5.1% |
| French Canadians | 88.6 /100 | #119 | Excellent 5.1% |
| Ukrainians | 88.4 /100 | #120 | Excellent 5.1% |
| Mongolians | 88.4 /100 | #121 | Excellent 5.1% |
| Nicaraguans | 88.2 /100 | #122 | Excellent 5.1% |
| Palestinians | 87.7 /100 | #123 | Excellent 5.1% |
| Immigrants | Latvia | 87.5 /100 | #124 | Excellent 5.1% |
| Immigrants | Lithuania | 87.2 /100 | #125 | Excellent 5.1% |
| Immigrants | Colombia | 86.8 /100 | #126 | Excellent 5.1% |
Demographics Similar to Seminole by Male Unemployment
In terms of male unemployment, the demographic groups most similar to Seminole are Central American (5.6%, a difference of 0.0%), Immigrants from Cambodia (5.6%, a difference of 0.020%), Immigrants from Panama (5.6%, a difference of 0.020%), Immigrants from Africa (5.6%, a difference of 0.040%), and Choctaw (5.6%, a difference of 0.10%).
| Demographics | Rating | Rank | Male Unemployment |
| Soviet Union | 3.2 /100 | #221 | Tragic 5.6% |
| Immigrants | Micronesia | 2.9 /100 | #222 | Tragic 5.6% |
| Creek | 2.6 /100 | #223 | Tragic 5.6% |
| Cherokee | 2.4 /100 | #224 | Tragic 5.6% |
| Panamanians | 1.9 /100 | #225 | Tragic 5.6% |
| Immigrants | Cambodia | 1.8 /100 | #226 | Tragic 5.6% |
| Immigrants | Panama | 1.8 /100 | #227 | Tragic 5.6% |
| Seminole | 1.8 /100 | #228 | Tragic 5.6% |
| Central Americans | 1.8 /100 | #229 | Tragic 5.6% |
| Immigrants | Africa | 1.7 /100 | #230 | Tragic 5.6% |
| Choctaw | 1.6 /100 | #231 | Tragic 5.6% |
| Moroccans | 1.6 /100 | #232 | Tragic 5.6% |
| Somalis | 1.5 /100 | #233 | Tragic 5.6% |
| Immigrants | Somalia | 1.5 /100 | #234 | Tragic 5.6% |
| Immigrants | Honduras | 1.5 /100 | #235 | Tragic 5.6% |