Canadian vs White/Caucasian Unemployment Among Ages 45 to 54 years
COMPARE
Canadian
White/Caucasian
Unemployment Among Ages 45 to 54 years
Unemployment Among Ages 45 to 54 years Comparison
Canadians
Whites/Caucasians
4.3%
UNEMPLOYMENT AMONG AGES 45 TO 54 YEARS
98.2/ 100
METRIC RATING
73rd/ 347
METRIC RANK
4.3%
UNEMPLOYMENT AMONG AGES 45 TO 54 YEARS
98.4/ 100
METRIC RATING
72nd/ 347
METRIC RANK
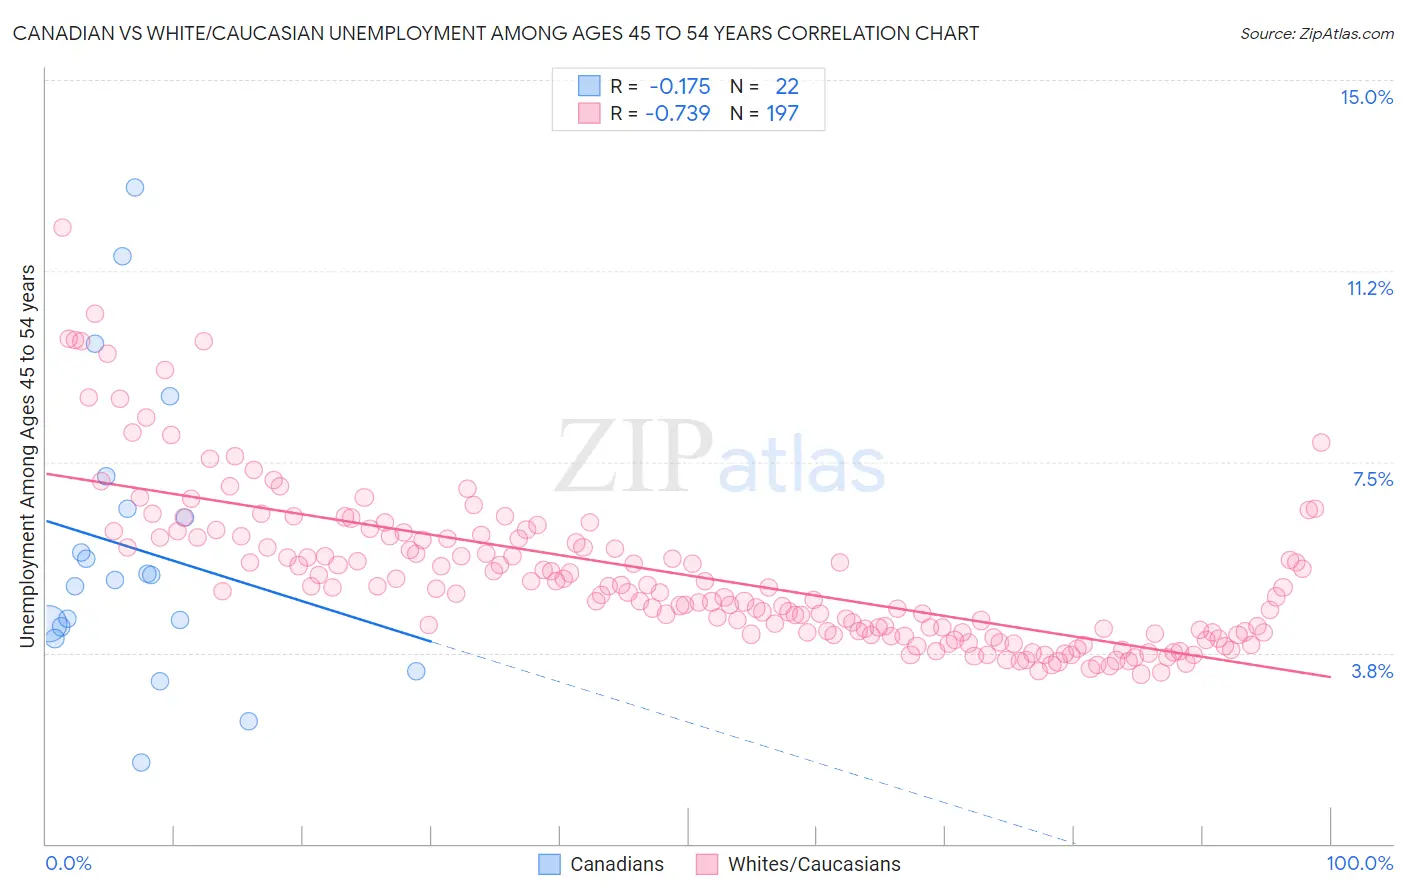
Canadian vs White/Caucasian Unemployment Among Ages 45 to 54 years Correlation Chart
The statistical analysis conducted on geographies consisting of 421,686,321 people shows a poor negative correlation between the proportion of Canadians and unemployment rate among population between the ages 45 and 54 in the United States with a correlation coefficient (R) of -0.175 and weighted average of 4.3%. Similarly, the statistical analysis conducted on geographies consisting of 535,899,454 people shows a strong negative correlation between the proportion of Whites/Caucasians and unemployment rate among population between the ages 45 and 54 in the United States with a correlation coefficient (R) of -0.739 and weighted average of 4.3%, a difference of 0.18%.
Unemployment Among Ages 45 to 54 years Correlation Summary
| Measurement | Canadian | White/Caucasian |
| Minimum | 1.6% | 3.3% |
| Maximum | 12.9% | 12.1% |
| Range | 11.3% | 8.8% |
| Mean | 5.8% | 5.3% |
| Median | 5.2% | 4.9% |
| Interquartile 25% (IQ1) | 4.3% | 4.1% |
| Interquartile 75% (IQ3) | 6.6% | 6.0% |
| Interquartile Range (IQR) | 2.3% | 1.9% |
| Standard Deviation (Sample) | 2.8% | 1.5% |
| Standard Deviation (Population) | 2.7% | 1.5% |
Demographics Similar to Canadians and Whites/Caucasians by Unemployment Among Ages 45 to 54 years
In terms of unemployment among ages 45 to 54 years, the demographic groups most similar to Canadians are Immigrants from Belgium (4.3%, a difference of 0.010%), Kenyan (4.3%, a difference of 0.040%), Slavic (4.3%, a difference of 0.040%), Chilean (4.3%, a difference of 0.10%), and German Russian (4.3%, a difference of 0.19%). Similarly, the demographic groups most similar to Whites/Caucasians are Palestinian (4.3%, a difference of 0.030%), Paraguayan (4.3%, a difference of 0.11%), Immigrants from Belgium (4.3%, a difference of 0.19%), Kenyan (4.3%, a difference of 0.22%), and Slavic (4.3%, a difference of 0.22%).
| Demographics | Rating | Rank | Unemployment Among Ages 45 to 54 years |
| Lithuanians | 99.1 /100 | #62 | Exceptional 4.3% |
| Pennsylvania Germans | 99.1 /100 | #63 | Exceptional 4.3% |
| Austrians | 99.0 /100 | #64 | Exceptional 4.3% |
| Immigrants | Sudan | 99.0 /100 | #65 | Exceptional 4.3% |
| Turks | 98.9 /100 | #66 | Exceptional 4.3% |
| Immigrants | Nepal | 98.9 /100 | #67 | Exceptional 4.3% |
| Slovaks | 98.8 /100 | #68 | Exceptional 4.3% |
| Immigrants | Japan | 98.7 /100 | #69 | Exceptional 4.3% |
| Paraguayans | 98.6 /100 | #70 | Exceptional 4.3% |
| Palestinians | 98.5 /100 | #71 | Exceptional 4.3% |
| Whites/Caucasians | 98.4 /100 | #72 | Exceptional 4.3% |
| Canadians | 98.2 /100 | #73 | Exceptional 4.3% |
| Immigrants | Belgium | 98.2 /100 | #74 | Exceptional 4.3% |
| Kenyans | 98.1 /100 | #75 | Exceptional 4.3% |
| Slavs | 98.1 /100 | #76 | Exceptional 4.3% |
| Chileans | 98.1 /100 | #77 | Exceptional 4.3% |
| German Russians | 97.9 /100 | #78 | Exceptional 4.3% |
| Serbians | 97.9 /100 | #79 | Exceptional 4.3% |
| Cambodians | 97.8 /100 | #80 | Exceptional 4.3% |
| Immigrants | Micronesia | 97.6 /100 | #81 | Exceptional 4.3% |
| Eastern Europeans | 97.6 /100 | #82 | Exceptional 4.3% |