Subsaharan African vs South American Indian Unemployment Among Youth under 25 years
COMPARE
Subsaharan African
South American Indian
Unemployment Among Youth under 25 years
Unemployment Among Youth under 25 years Comparison
Sub-Saharan Africans
South American Indians
12.6%
UNEMPLOYMENT AMONG YOUTH UNDER 25 YEARS
0.0/ 100
METRIC RATING
267th/ 347
METRIC RANK
12.1%
UNEMPLOYMENT AMONG YOUTH UNDER 25 YEARS
1.6/ 100
METRIC RATING
233rd/ 347
METRIC RANK
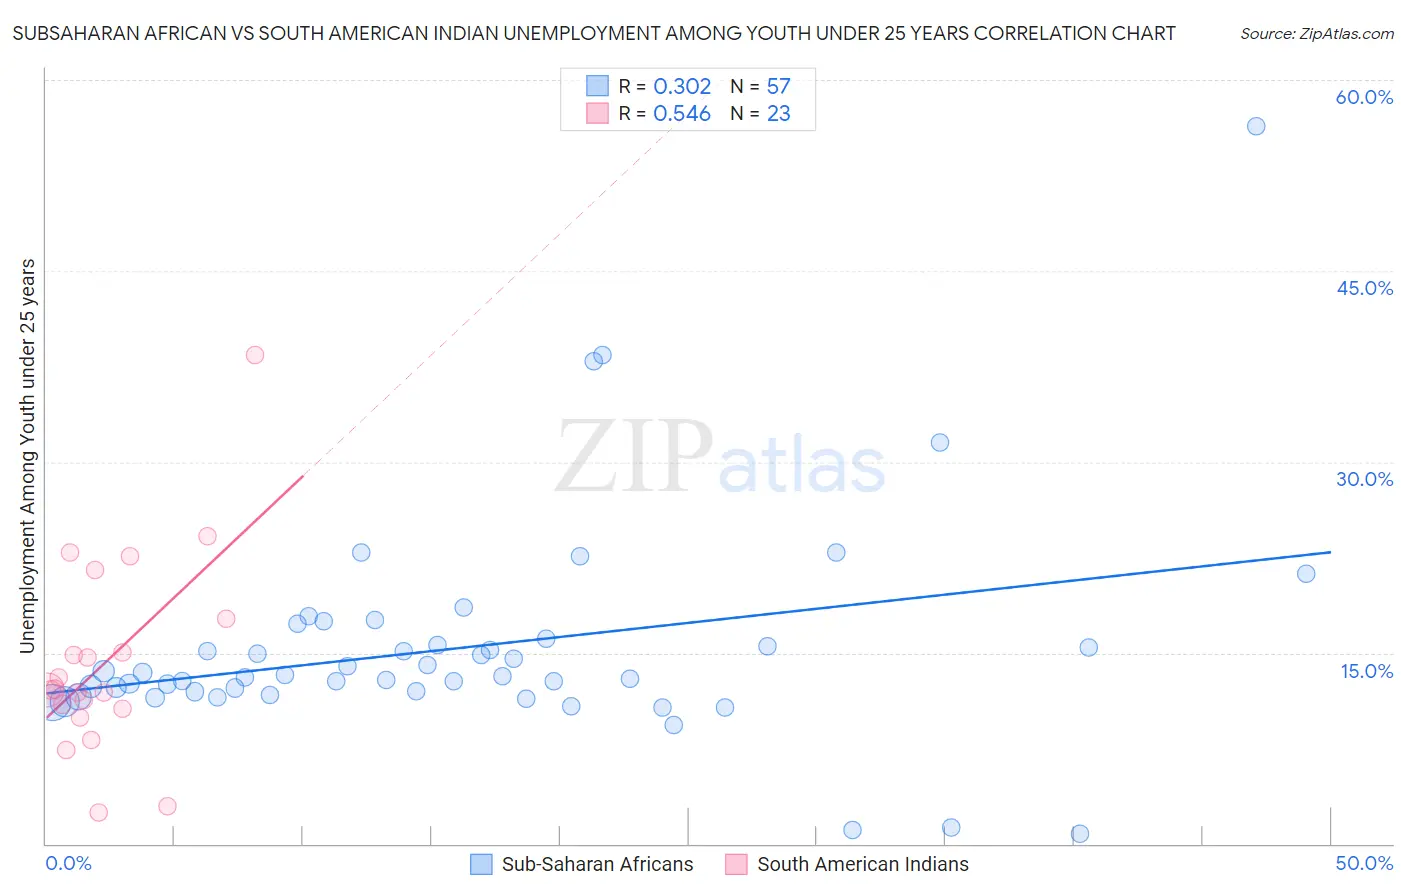
Subsaharan African vs South American Indian Unemployment Among Youth under 25 years Correlation Chart
The statistical analysis conducted on geographies consisting of 498,174,869 people shows a mild positive correlation between the proportion of Sub-Saharan Africans and unemployment rate among youth under the age of 25 in the United States with a correlation coefficient (R) of 0.302 and weighted average of 12.6%. Similarly, the statistical analysis conducted on geographies consisting of 164,135,227 people shows a substantial positive correlation between the proportion of South American Indians and unemployment rate among youth under the age of 25 in the United States with a correlation coefficient (R) of 0.546 and weighted average of 12.1%, a difference of 4.5%.
Unemployment Among Youth under 25 years Correlation Summary
| Measurement | Subsaharan African | South American Indian |
| Minimum | 0.80% | 2.5% |
| Maximum | 56.4% | 38.4% |
| Range | 55.6% | 35.9% |
| Mean | 15.4% | 14.3% |
| Median | 13.1% | 12.1% |
| Interquartile 25% (IQ1) | 11.8% | 10.6% |
| Interquartile 75% (IQ3) | 15.8% | 17.7% |
| Interquartile Range (IQR) | 4.0% | 7.1% |
| Standard Deviation (Sample) | 8.6% | 7.8% |
| Standard Deviation (Population) | 8.6% | 7.6% |
Similar Demographics by Unemployment Among Youth under 25 years
Demographics Similar to Sub-Saharan Africans by Unemployment Among Youth under 25 years
In terms of unemployment among youth under 25 years, the demographic groups most similar to Sub-Saharan Africans are Tlingit-Haida (12.7%, a difference of 0.080%), Immigrants from Latin America (12.6%, a difference of 0.13%), Kiowa (12.7%, a difference of 0.20%), Nepalese (12.5%, a difference of 1.0%), and Puget Sound Salish (12.5%, a difference of 1.1%).
| Demographics | Rating | Rank | Unemployment Among Youth under 25 years |
| Immigrants | Panama | 0.1 /100 | #260 | Tragic 12.4% |
| Immigrants | El Salvador | 0.1 /100 | #261 | Tragic 12.4% |
| Immigrants | Mexico | 0.1 /100 | #262 | Tragic 12.4% |
| Cree | 0.1 /100 | #263 | Tragic 12.4% |
| Puget Sound Salish | 0.1 /100 | #264 | Tragic 12.5% |
| Nepalese | 0.0 /100 | #265 | Tragic 12.5% |
| Immigrants | Latin America | 0.0 /100 | #266 | Tragic 12.6% |
| Sub-Saharan Africans | 0.0 /100 | #267 | Tragic 12.6% |
| Tlingit-Haida | 0.0 /100 | #268 | Tragic 12.7% |
| Kiowa | 0.0 /100 | #269 | Tragic 12.7% |
| Immigrants | Liberia | 0.0 /100 | #270 | Tragic 12.8% |
| Immigrants | Bahamas | 0.0 /100 | #271 | Tragic 12.9% |
| Cape Verdeans | 0.0 /100 | #272 | Tragic 12.9% |
| Nigerians | 0.0 /100 | #273 | Tragic 13.0% |
| Immigrants | Nigeria | 0.0 /100 | #274 | Tragic 13.0% |
Demographics Similar to South American Indians by Unemployment Among Youth under 25 years
In terms of unemployment among youth under 25 years, the demographic groups most similar to South American Indians are Immigrants from Belarus (12.1%, a difference of 0.020%), Immigrants from South America (12.1%, a difference of 0.090%), Guatemalan (12.1%, a difference of 0.15%), Immigrants from Guatemala (12.1%, a difference of 0.16%), and Choctaw (12.1%, a difference of 0.19%).
| Demographics | Rating | Rank | Unemployment Among Youth under 25 years |
| Immigrants | Israel | 2.6 /100 | #226 | Tragic 12.0% |
| Immigrants | Iran | 2.6 /100 | #227 | Tragic 12.0% |
| Immigrants | Fiji | 2.1 /100 | #228 | Tragic 12.1% |
| Moroccans | 2.1 /100 | #229 | Tragic 12.1% |
| Choctaw | 1.9 /100 | #230 | Tragic 12.1% |
| Immigrants | South America | 1.8 /100 | #231 | Tragic 12.1% |
| Immigrants | Belarus | 1.6 /100 | #232 | Tragic 12.1% |
| South American Indians | 1.6 /100 | #233 | Tragic 12.1% |
| Guatemalans | 1.4 /100 | #234 | Tragic 12.1% |
| Immigrants | Guatemala | 1.4 /100 | #235 | Tragic 12.1% |
| Immigrants | Immigrants | 1.3 /100 | #236 | Tragic 12.1% |
| Native Hawaiians | 1.3 /100 | #237 | Tragic 12.1% |
| Albanians | 1.2 /100 | #238 | Tragic 12.1% |
| Immigrants | Africa | 1.1 /100 | #239 | Tragic 12.1% |
| Dutch West Indians | 1.1 /100 | #240 | Tragic 12.1% |