Subsaharan African vs Palestinian Unemployment Among Youth under 25 years
COMPARE
Subsaharan African
Palestinian
Unemployment Among Youth under 25 years
Unemployment Among Youth under 25 years Comparison
Sub-Saharan Africans
Palestinians
12.6%
UNEMPLOYMENT AMONG YOUTH UNDER 25 YEARS
0.0/ 100
METRIC RATING
267th/ 347
METRIC RANK
11.8%
UNEMPLOYMENT AMONG YOUTH UNDER 25 YEARS
16.0/ 100
METRIC RATING
201st/ 347
METRIC RANK
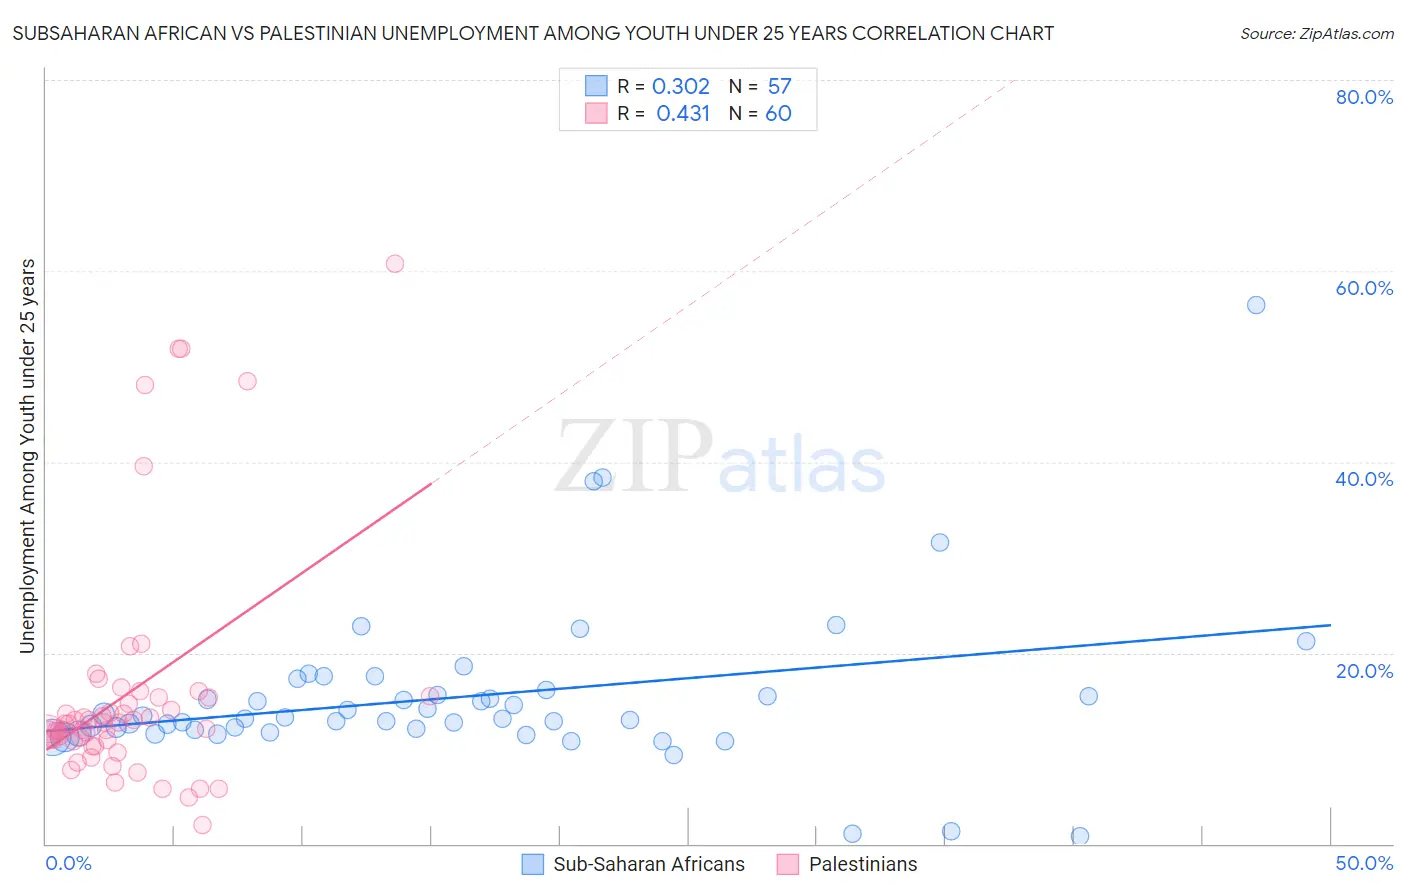
Subsaharan African vs Palestinian Unemployment Among Youth under 25 years Correlation Chart
The statistical analysis conducted on geographies consisting of 498,174,869 people shows a mild positive correlation between the proportion of Sub-Saharan Africans and unemployment rate among youth under the age of 25 in the United States with a correlation coefficient (R) of 0.302 and weighted average of 12.6%. Similarly, the statistical analysis conducted on geographies consisting of 215,804,460 people shows a moderate positive correlation between the proportion of Palestinians and unemployment rate among youth under the age of 25 in the United States with a correlation coefficient (R) of 0.431 and weighted average of 11.8%, a difference of 7.1%.
Unemployment Among Youth under 25 years Correlation Summary
| Measurement | Subsaharan African | Palestinian |
| Minimum | 0.80% | 2.0% |
| Maximum | 56.4% | 60.7% |
| Range | 55.6% | 58.7% |
| Mean | 15.4% | 15.7% |
| Median | 13.1% | 12.6% |
| Interquartile 25% (IQ1) | 11.8% | 10.8% |
| Interquartile 75% (IQ3) | 15.8% | 15.3% |
| Interquartile Range (IQR) | 4.0% | 4.5% |
| Standard Deviation (Sample) | 8.6% | 12.2% |
| Standard Deviation (Population) | 8.6% | 12.1% |
Similar Demographics by Unemployment Among Youth under 25 years
Demographics Similar to Sub-Saharan Africans by Unemployment Among Youth under 25 years
In terms of unemployment among youth under 25 years, the demographic groups most similar to Sub-Saharan Africans are Tlingit-Haida (12.7%, a difference of 0.080%), Immigrants from Latin America (12.6%, a difference of 0.13%), Kiowa (12.7%, a difference of 0.20%), Nepalese (12.5%, a difference of 1.0%), and Puget Sound Salish (12.5%, a difference of 1.1%).
| Demographics | Rating | Rank | Unemployment Among Youth under 25 years |
| Immigrants | Panama | 0.1 /100 | #260 | Tragic 12.4% |
| Immigrants | El Salvador | 0.1 /100 | #261 | Tragic 12.4% |
| Immigrants | Mexico | 0.1 /100 | #262 | Tragic 12.4% |
| Cree | 0.1 /100 | #263 | Tragic 12.4% |
| Puget Sound Salish | 0.1 /100 | #264 | Tragic 12.5% |
| Nepalese | 0.0 /100 | #265 | Tragic 12.5% |
| Immigrants | Latin America | 0.0 /100 | #266 | Tragic 12.6% |
| Sub-Saharan Africans | 0.0 /100 | #267 | Tragic 12.6% |
| Tlingit-Haida | 0.0 /100 | #268 | Tragic 12.7% |
| Kiowa | 0.0 /100 | #269 | Tragic 12.7% |
| Immigrants | Liberia | 0.0 /100 | #270 | Tragic 12.8% |
| Immigrants | Bahamas | 0.0 /100 | #271 | Tragic 12.9% |
| Cape Verdeans | 0.0 /100 | #272 | Tragic 12.9% |
| Nigerians | 0.0 /100 | #273 | Tragic 13.0% |
| Immigrants | Nigeria | 0.0 /100 | #274 | Tragic 13.0% |
Demographics Similar to Palestinians by Unemployment Among Youth under 25 years
In terms of unemployment among youth under 25 years, the demographic groups most similar to Palestinians are Marshallese (11.8%, a difference of 0.020%), Immigrants from Peru (11.8%, a difference of 0.050%), Immigrants from Costa Rica (11.8%, a difference of 0.060%), Arab (11.8%, a difference of 0.15%), and Peruvian (11.8%, a difference of 0.16%).
| Demographics | Rating | Rank | Unemployment Among Youth under 25 years |
| Immigrants | Sri Lanka | 27.8 /100 | #194 | Fair 11.7% |
| Paraguayans | 27.2 /100 | #195 | Fair 11.7% |
| Egyptians | 26.9 /100 | #196 | Fair 11.7% |
| Koreans | 23.9 /100 | #197 | Fair 11.7% |
| Cherokee | 21.2 /100 | #198 | Fair 11.8% |
| Immigrants | Colombia | 20.9 /100 | #199 | Fair 11.8% |
| Arabs | 18.0 /100 | #200 | Poor 11.8% |
| Palestinians | 16.0 /100 | #201 | Poor 11.8% |
| Marshallese | 15.8 /100 | #202 | Poor 11.8% |
| Immigrants | Peru | 15.3 /100 | #203 | Poor 11.8% |
| Immigrants | Costa Rica | 15.2 /100 | #204 | Poor 11.8% |
| Peruvians | 14.0 /100 | #205 | Poor 11.8% |
| Immigrants | Pakistan | 12.6 /100 | #206 | Poor 11.8% |
| Immigrants | Southern Europe | 12.3 /100 | #207 | Poor 11.8% |
| Comanche | 12.1 /100 | #208 | Poor 11.8% |