Nonimmigrants vs Slovene Unemployment Among Ages 55 to 59 years
COMPARE
Nonimmigrants
Slovene
Unemployment Among Ages 55 to 59 years
Unemployment Among Ages 55 to 59 years Comparison
Nonimmigrants
Slovenes
4.9%
UNEMPLOYMENT AMONG AGES 55 TO 59 YEARS
11.2/ 100
METRIC RATING
212th/ 347
METRIC RANK
4.6%
UNEMPLOYMENT AMONG AGES 55 TO 59 YEARS
99.3/ 100
METRIC RATING
62nd/ 347
METRIC RANK
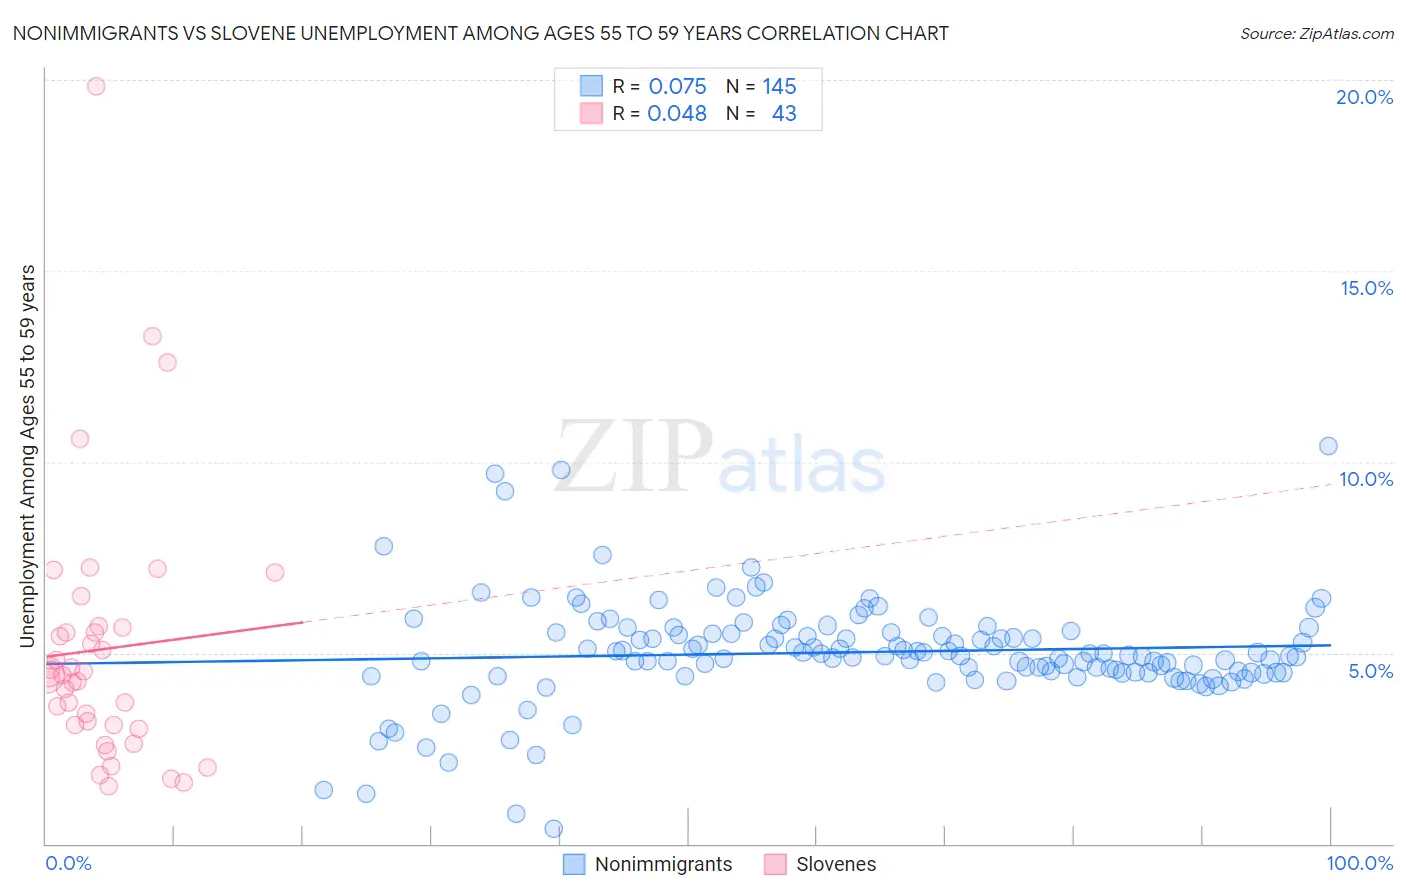
Nonimmigrants vs Slovene Unemployment Among Ages 55 to 59 years Correlation Chart
The statistical analysis conducted on geographies consisting of 492,378,712 people shows a slight positive correlation between the proportion of Nonimmigrants and unemployment rate among population between the ages 55 and 59 in the United States with a correlation coefficient (R) of 0.075 and weighted average of 4.9%. Similarly, the statistical analysis conducted on geographies consisting of 247,033,366 people shows no correlation between the proportion of Slovenes and unemployment rate among population between the ages 55 and 59 in the United States with a correlation coefficient (R) of 0.048 and weighted average of 4.6%, a difference of 7.6%.
Unemployment Among Ages 55 to 59 years Correlation Summary
| Measurement | Nonimmigrants | Slovene |
| Minimum | 0.40% | 1.5% |
| Maximum | 10.4% | 19.8% |
| Range | 10.0% | 18.3% |
| Mean | 5.0% | 5.1% |
| Median | 4.9% | 4.4% |
| Interquartile 25% (IQ1) | 4.5% | 3.1% |
| Interquartile 75% (IQ3) | 5.5% | 5.7% |
| Interquartile Range (IQR) | 1.1% | 2.5% |
| Standard Deviation (Sample) | 1.4% | 3.5% |
| Standard Deviation (Population) | 1.4% | 3.4% |
Similar Demographics by Unemployment Among Ages 55 to 59 years
Demographics Similar to Nonimmigrants by Unemployment Among Ages 55 to 59 years
In terms of unemployment among ages 55 to 59 years, the demographic groups most similar to Nonimmigrants are Bermudan (4.9%, a difference of 0.020%), Immigrants from Denmark (4.9%, a difference of 0.090%), Creek (4.9%, a difference of 0.16%), Hawaiian (4.9%, a difference of 0.16%), and Immigrants from Haiti (4.9%, a difference of 0.20%).
| Demographics | Rating | Rank | Unemployment Among Ages 55 to 59 years |
| Haitians | 18.1 /100 | #205 | Poor 4.9% |
| Immigrants | Belarus | 14.1 /100 | #206 | Poor 4.9% |
| Immigrants | Australia | 14.1 /100 | #207 | Poor 4.9% |
| Immigrants | Kazakhstan | 14.0 /100 | #208 | Poor 4.9% |
| Immigrants | Haiti | 13.3 /100 | #209 | Poor 4.9% |
| Creek | 12.9 /100 | #210 | Poor 4.9% |
| Hawaiians | 12.8 /100 | #211 | Poor 4.9% |
| Immigrants | Nonimmigrants | 11.2 /100 | #212 | Poor 4.9% |
| Bermudans | 11.0 /100 | #213 | Poor 4.9% |
| Immigrants | Denmark | 10.3 /100 | #214 | Poor 4.9% |
| Syrians | 8.6 /100 | #215 | Tragic 4.9% |
| Spanish Americans | 8.1 /100 | #216 | Tragic 4.9% |
| Immigrants | Brazil | 8.1 /100 | #217 | Tragic 4.9% |
| Immigrants | Austria | 8.0 /100 | #218 | Tragic 4.9% |
| Immigrants | Nigeria | 8.0 /100 | #219 | Tragic 4.9% |
Demographics Similar to Slovenes by Unemployment Among Ages 55 to 59 years
In terms of unemployment among ages 55 to 59 years, the demographic groups most similar to Slovenes are Immigrants from South Central Asia (4.6%, a difference of 0.080%), Immigrants from Argentina (4.6%, a difference of 0.25%), Argentinean (4.6%, a difference of 0.26%), Sudanese (4.6%, a difference of 0.27%), and Dutch (4.6%, a difference of 0.34%).
| Demographics | Rating | Rank | Unemployment Among Ages 55 to 59 years |
| Immigrants | Nepal | 99.6 /100 | #55 | Exceptional 4.5% |
| Welsh | 99.6 /100 | #56 | Exceptional 4.5% |
| Northern Europeans | 99.6 /100 | #57 | Exceptional 4.5% |
| Okinawans | 99.6 /100 | #58 | Exceptional 4.5% |
| Immigrants | Uganda | 99.5 /100 | #59 | Exceptional 4.6% |
| Dutch | 99.5 /100 | #60 | Exceptional 4.6% |
| Immigrants | Argentina | 99.5 /100 | #61 | Exceptional 4.6% |
| Slovenes | 99.3 /100 | #62 | Exceptional 4.6% |
| Immigrants | South Central Asia | 99.3 /100 | #63 | Exceptional 4.6% |
| Argentineans | 99.1 /100 | #64 | Exceptional 4.6% |
| Sudanese | 99.1 /100 | #65 | Exceptional 4.6% |
| Mongolians | 99.0 /100 | #66 | Exceptional 4.6% |
| Ugandans | 99.0 /100 | #67 | Exceptional 4.6% |
| Immigrants | Micronesia | 99.0 /100 | #68 | Exceptional 4.6% |
| Czechoslovakians | 99.0 /100 | #69 | Exceptional 4.6% |