Immigrants from Kuwait vs Slovene Unemployment Among Ages 55 to 59 years
COMPARE
Immigrants from Kuwait
Slovene
Unemployment Among Ages 55 to 59 years
Unemployment Among Ages 55 to 59 years Comparison
Immigrants from Kuwait
Slovenes
4.5%
UNEMPLOYMENT AMONG AGES 55 TO 59 YEARS
99.8/ 100
METRIC RATING
42nd/ 347
METRIC RANK
4.6%
UNEMPLOYMENT AMONG AGES 55 TO 59 YEARS
99.3/ 100
METRIC RATING
62nd/ 347
METRIC RANK
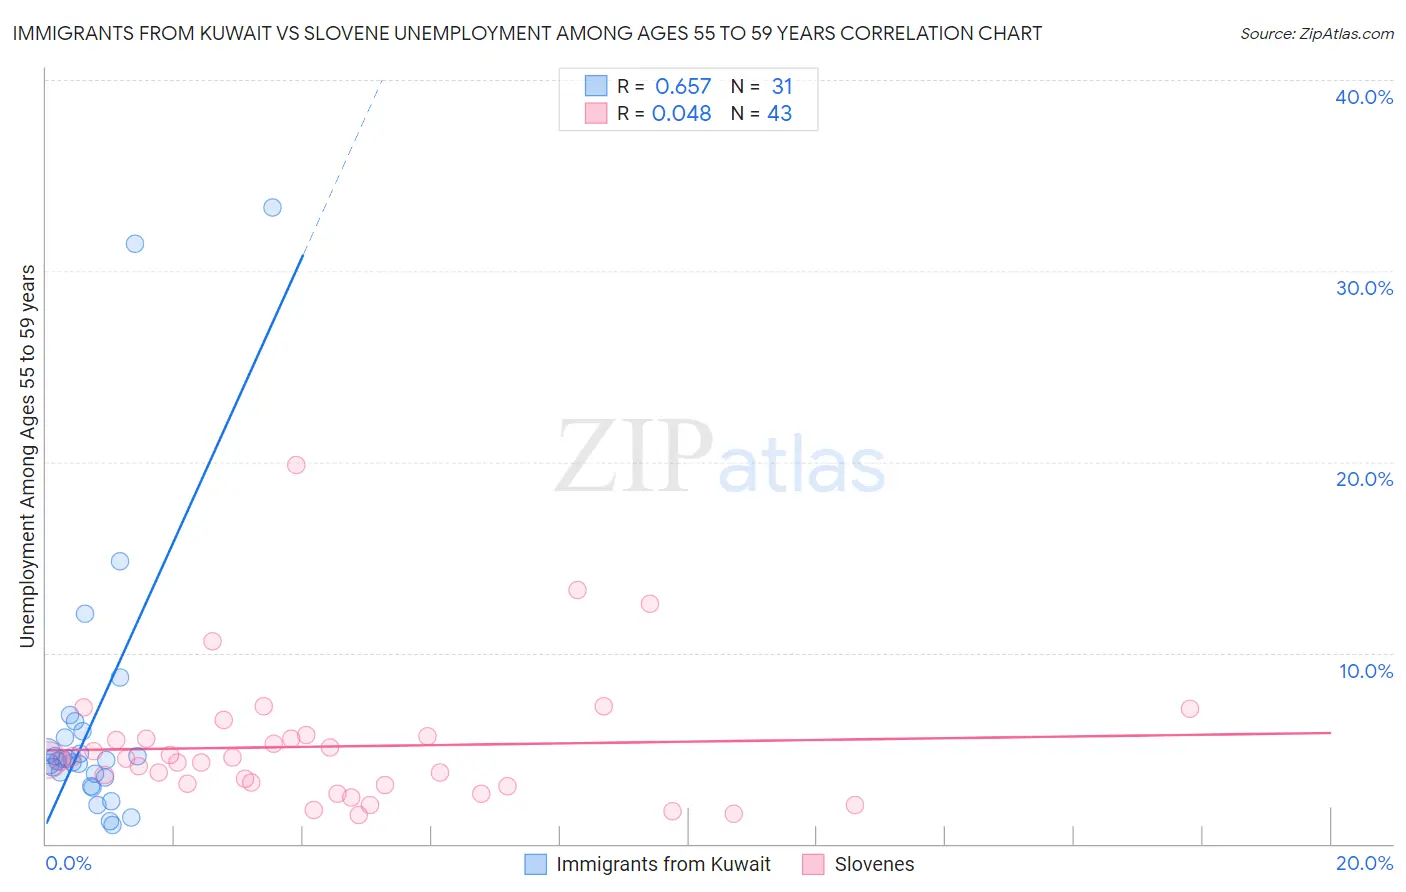
Immigrants from Kuwait vs Slovene Unemployment Among Ages 55 to 59 years Correlation Chart
The statistical analysis conducted on geographies consisting of 133,899,475 people shows a significant positive correlation between the proportion of Immigrants from Kuwait and unemployment rate among population between the ages 55 and 59 in the United States with a correlation coefficient (R) of 0.657 and weighted average of 4.5%. Similarly, the statistical analysis conducted on geographies consisting of 247,033,366 people shows no correlation between the proportion of Slovenes and unemployment rate among population between the ages 55 and 59 in the United States with a correlation coefficient (R) of 0.048 and weighted average of 4.6%, a difference of 1.4%.
Unemployment Among Ages 55 to 59 years Correlation Summary
| Measurement | Immigrants from Kuwait | Slovene |
| Minimum | 1.0% | 1.5% |
| Maximum | 33.3% | 19.8% |
| Range | 32.3% | 18.3% |
| Mean | 6.5% | 5.1% |
| Median | 4.4% | 4.4% |
| Interquartile 25% (IQ1) | 3.5% | 3.1% |
| Interquartile 75% (IQ3) | 5.9% | 5.7% |
| Interquartile Range (IQR) | 2.4% | 2.5% |
| Standard Deviation (Sample) | 7.5% | 3.5% |
| Standard Deviation (Population) | 7.3% | 3.4% |
Demographics Similar to Immigrants from Kuwait and Slovenes by Unemployment Among Ages 55 to 59 years
In terms of unemployment among ages 55 to 59 years, the demographic groups most similar to Immigrants from Kuwait are Immigrants from Korea (4.5%, a difference of 0.040%), European (4.5%, a difference of 0.040%), British (4.5%, a difference of 0.11%), Immigrants from Zaire (4.5%, a difference of 0.13%), and German Russian (4.5%, a difference of 0.19%). Similarly, the demographic groups most similar to Slovenes are Immigrants from Argentina (4.6%, a difference of 0.25%), Dutch (4.6%, a difference of 0.34%), Immigrants from Uganda (4.6%, a difference of 0.39%), Okinawan (4.5%, a difference of 0.61%), and Northern European (4.5%, a difference of 0.63%).
| Demographics | Rating | Rank | Unemployment Among Ages 55 to 59 years |
| Immigrants | Kuwait | 99.8 /100 | #42 | Exceptional 4.5% |
| Immigrants | Korea | 99.8 /100 | #43 | Exceptional 4.5% |
| Europeans | 99.8 /100 | #44 | Exceptional 4.5% |
| British | 99.8 /100 | #45 | Exceptional 4.5% |
| Immigrants | Zaire | 99.8 /100 | #46 | Exceptional 4.5% |
| German Russians | 99.8 /100 | #47 | Exceptional 4.5% |
| Immigrants | Moldova | 99.7 /100 | #48 | Exceptional 4.5% |
| Immigrants | Saudi Arabia | 99.7 /100 | #49 | Exceptional 4.5% |
| Immigrants | Pakistan | 99.7 /100 | #50 | Exceptional 4.5% |
| Maltese | 99.7 /100 | #51 | Exceptional 4.5% |
| Scottish | 99.7 /100 | #52 | Exceptional 4.5% |
| Immigrants | Middle Africa | 99.7 /100 | #53 | Exceptional 4.5% |
| Burmese | 99.7 /100 | #54 | Exceptional 4.5% |
| Immigrants | Nepal | 99.6 /100 | #55 | Exceptional 4.5% |
| Welsh | 99.6 /100 | #56 | Exceptional 4.5% |
| Northern Europeans | 99.6 /100 | #57 | Exceptional 4.5% |
| Okinawans | 99.6 /100 | #58 | Exceptional 4.5% |
| Immigrants | Uganda | 99.5 /100 | #59 | Exceptional 4.6% |
| Dutch | 99.5 /100 | #60 | Exceptional 4.6% |
| Immigrants | Argentina | 99.5 /100 | #61 | Exceptional 4.6% |
| Slovenes | 99.3 /100 | #62 | Exceptional 4.6% |