Dutch West Indian vs Immigrants from Cabo Verde Unemployment Among Ages 25 to 29 years
COMPARE
Dutch West Indian
Immigrants from Cabo Verde
Unemployment Among Ages 25 to 29 years
Unemployment Among Ages 25 to 29 years Comparison
Dutch West Indians
Immigrants from Cabo Verde
8.2%
UNEMPLOYMENT AMONG AGES 25 TO 29 YEARS
0.0/ 100
METRIC RATING
312th/ 347
METRIC RANK
6.8%
UNEMPLOYMENT AMONG AGES 25 TO 29 YEARS
16.2/ 100
METRIC RATING
212th/ 347
METRIC RANK
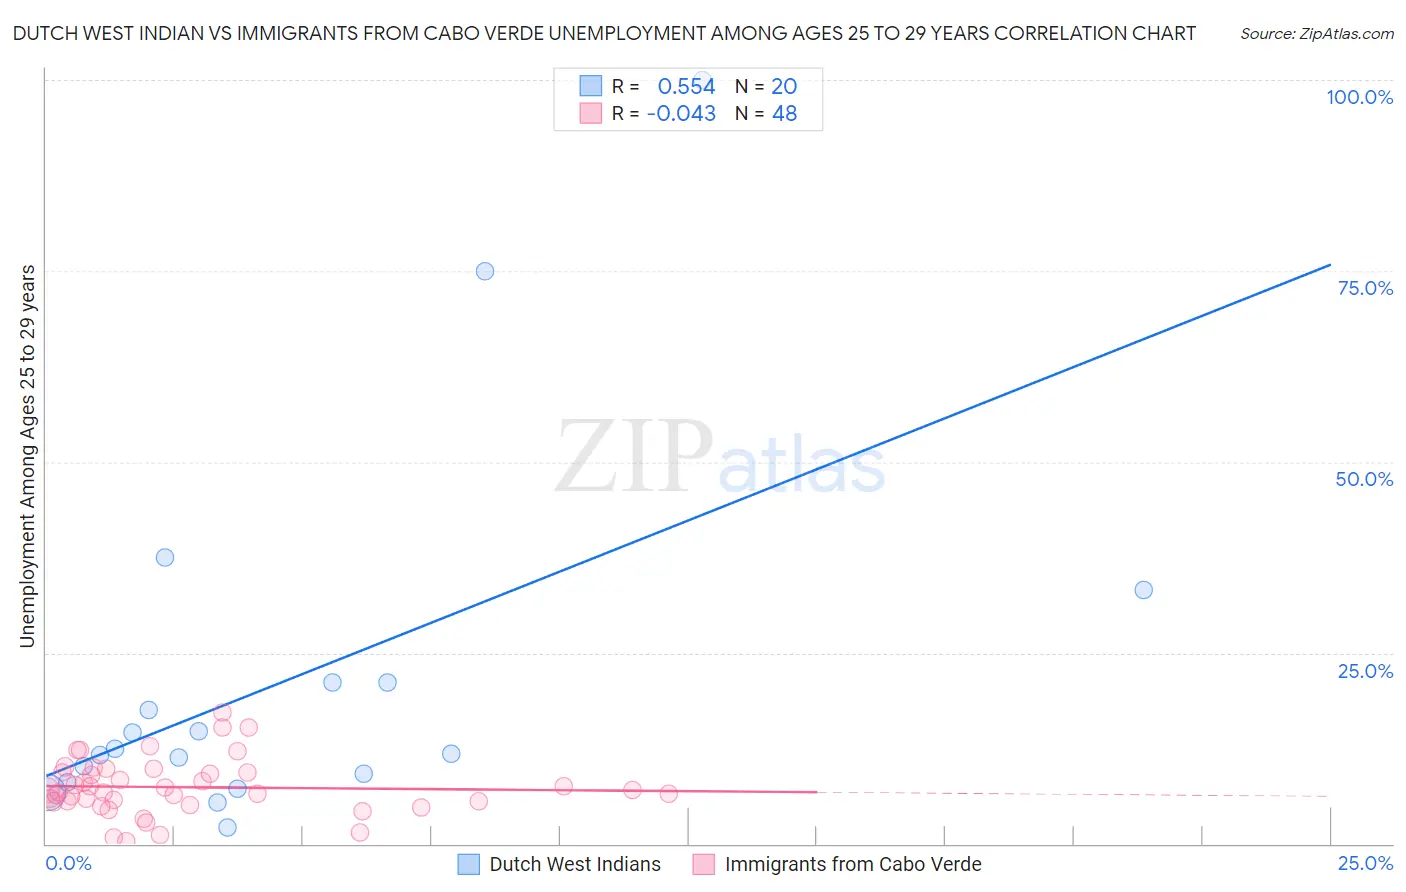
Dutch West Indian vs Immigrants from Cabo Verde Unemployment Among Ages 25 to 29 years Correlation Chart
The statistical analysis conducted on geographies consisting of 83,674,988 people shows a substantial positive correlation between the proportion of Dutch West Indians and unemployment rate among population between the ages 25 and 29 in the United States with a correlation coefficient (R) of 0.554 and weighted average of 8.2%. Similarly, the statistical analysis conducted on geographies consisting of 37,701,958 people shows no correlation between the proportion of Immigrants from Cabo Verde and unemployment rate among population between the ages 25 and 29 in the United States with a correlation coefficient (R) of -0.043 and weighted average of 6.8%, a difference of 20.2%.
Unemployment Among Ages 25 to 29 years Correlation Summary
| Measurement | Dutch West Indian | Immigrants from Cabo Verde |
| Minimum | 2.2% | 0.30% |
| Maximum | 100.0% | 17.2% |
| Range | 97.8% | 16.9% |
| Mean | 21.5% | 7.4% |
| Median | 12.1% | 6.9% |
| Interquartile 25% (IQ1) | 8.6% | 5.6% |
| Interquartile 75% (IQ3) | 21.1% | 9.3% |
| Interquartile Range (IQR) | 12.5% | 3.8% |
| Standard Deviation (Sample) | 24.5% | 3.7% |
| Standard Deviation (Population) | 23.9% | 3.6% |
Similar Demographics by Unemployment Among Ages 25 to 29 years
Demographics Similar to Dutch West Indians by Unemployment Among Ages 25 to 29 years
In terms of unemployment among ages 25 to 29 years, the demographic groups most similar to Dutch West Indians are Immigrants from the Azores (8.1%, a difference of 1.1%), U.S. Virgin Islander (8.1%, a difference of 1.3%), Immigrants from Haiti (8.1%, a difference of 1.3%), Immigrants from Jamaica (8.1%, a difference of 1.3%), and Immigrants from Barbados (8.0%, a difference of 1.8%).
| Demographics | Rating | Rank | Unemployment Among Ages 25 to 29 years |
| Tsimshian | 0.0 /100 | #305 | Tragic 8.0% |
| Haitians | 0.0 /100 | #306 | Tragic 8.0% |
| Immigrants | Barbados | 0.0 /100 | #307 | Tragic 8.0% |
| Immigrants | Jamaica | 0.0 /100 | #308 | Tragic 8.1% |
| Immigrants | Haiti | 0.0 /100 | #309 | Tragic 8.1% |
| U.S. Virgin Islanders | 0.0 /100 | #310 | Tragic 8.1% |
| Immigrants | Azores | 0.0 /100 | #311 | Tragic 8.1% |
| Dutch West Indians | 0.0 /100 | #312 | Tragic 8.2% |
| Immigrants | St. Vincent and the Grenadines | 0.0 /100 | #313 | Tragic 8.4% |
| Immigrants | Dominica | 0.0 /100 | #314 | Tragic 8.4% |
| British West Indians | 0.0 /100 | #315 | Tragic 8.4% |
| Immigrants | Grenada | 0.0 /100 | #316 | Tragic 8.4% |
| Immigrants | Guyana | 0.0 /100 | #317 | Tragic 8.5% |
| Guyanese | 0.0 /100 | #318 | Tragic 8.5% |
| Immigrants | Armenia | 0.0 /100 | #319 | Tragic 8.5% |
Demographics Similar to Immigrants from Cabo Verde by Unemployment Among Ages 25 to 29 years
In terms of unemployment among ages 25 to 29 years, the demographic groups most similar to Immigrants from Cabo Verde are Immigrants from Philippines (6.8%, a difference of 0.050%), Canadian (6.8%, a difference of 0.080%), Hawaiian (6.8%, a difference of 0.10%), Immigrants from Syria (6.8%, a difference of 0.12%), and Liberian (6.8%, a difference of 0.17%).
| Demographics | Rating | Rank | Unemployment Among Ages 25 to 29 years |
| Immigrants | England | 19.8 /100 | #205 | Poor 6.8% |
| Ugandans | 19.8 /100 | #206 | Poor 6.8% |
| Immigrants | Denmark | 19.0 /100 | #207 | Poor 6.8% |
| Immigrants | Germany | 18.8 /100 | #208 | Poor 6.8% |
| Hawaiians | 17.1 /100 | #209 | Poor 6.8% |
| Canadians | 16.9 /100 | #210 | Poor 6.8% |
| Immigrants | Philippines | 16.7 /100 | #211 | Poor 6.8% |
| Immigrants | Cabo Verde | 16.2 /100 | #212 | Poor 6.8% |
| Immigrants | Syria | 15.1 /100 | #213 | Poor 6.8% |
| Liberians | 14.7 /100 | #214 | Poor 6.8% |
| Spanish | 14.4 /100 | #215 | Poor 6.8% |
| Slovaks | 14.3 /100 | #216 | Poor 6.8% |
| Ute | 13.4 /100 | #217 | Poor 6.8% |
| Immigrants | Austria | 12.3 /100 | #218 | Poor 6.8% |
| Whites/Caucasians | 10.6 /100 | #219 | Poor 6.9% |