Spanish American Indian vs Immigrants from Zaire Male Unemployment
COMPARE
Spanish American Indian
Immigrants from Zaire
Male Unemployment
Male Unemployment Comparison
Spanish American Indians
Immigrants from Zaire
6.2%
MALE UNEMPLOYMENT
0.0/ 100
METRIC RATING
284th/ 347
METRIC RANK
5.4%
MALE UNEMPLOYMENT
13.7/ 100
METRIC RATING
200th/ 347
METRIC RANK
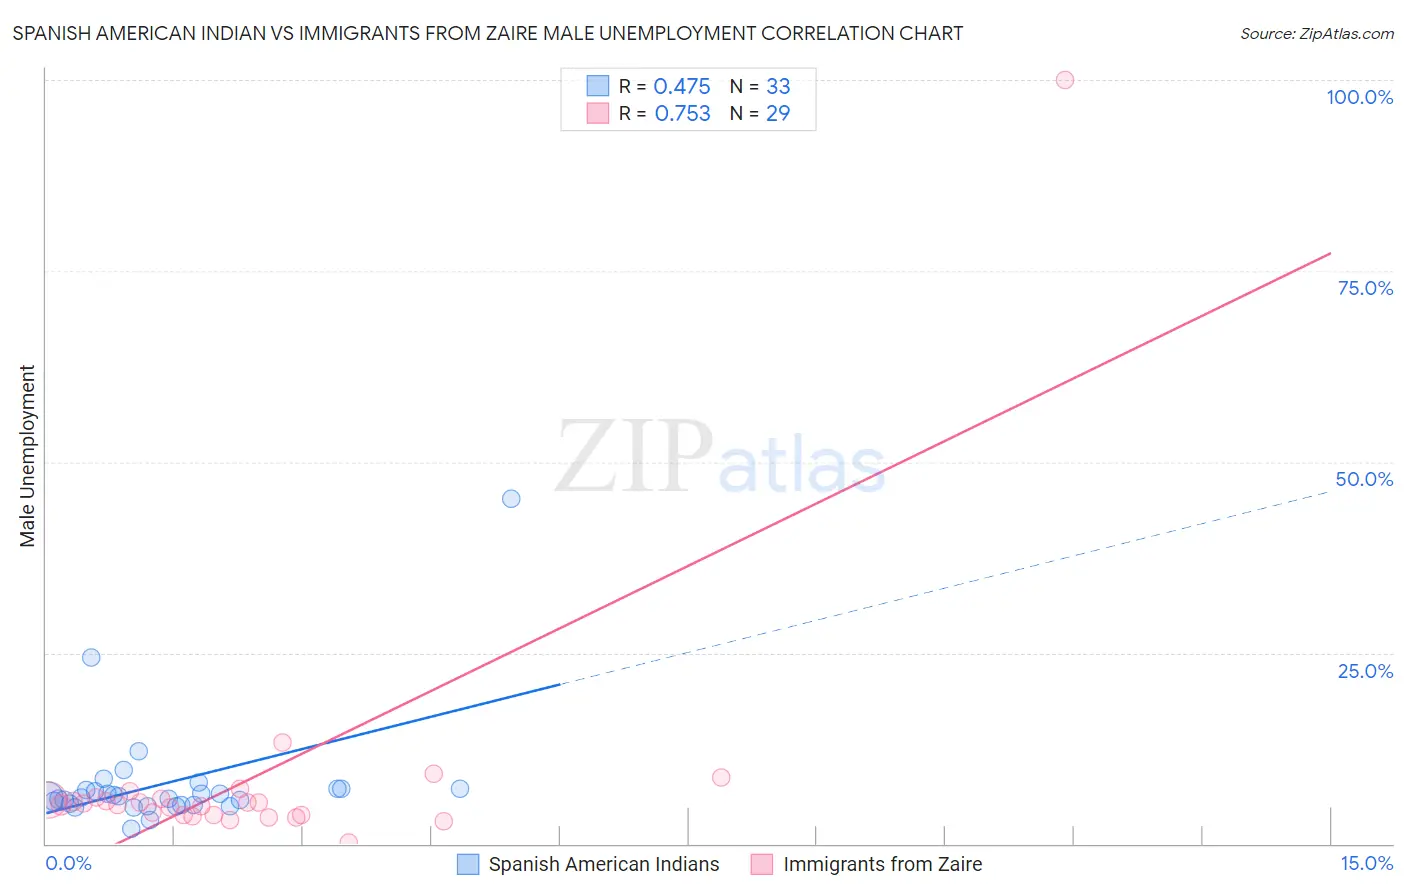
Spanish American Indian vs Immigrants from Zaire Male Unemployment Correlation Chart
The statistical analysis conducted on geographies consisting of 73,090,721 people shows a moderate positive correlation between the proportion of Spanish American Indians and unemployment rate among males in the United States with a correlation coefficient (R) of 0.475 and weighted average of 6.2%. Similarly, the statistical analysis conducted on geographies consisting of 107,173,070 people shows a strong positive correlation between the proportion of Immigrants from Zaire and unemployment rate among males in the United States with a correlation coefficient (R) of 0.753 and weighted average of 5.4%, a difference of 14.5%.
Male Unemployment Correlation Summary
| Measurement | Spanish American Indian | Immigrants from Zaire |
| Minimum | 1.9% | 0.20% |
| Maximum | 45.2% | 100.0% |
| Range | 43.3% | 99.8% |
| Mean | 7.9% | 8.5% |
| Median | 6.0% | 5.3% |
| Interquartile 25% (IQ1) | 5.1% | 3.7% |
| Interquartile 75% (IQ3) | 7.2% | 6.0% |
| Interquartile Range (IQR) | 2.1% | 2.3% |
| Standard Deviation (Sample) | 7.6% | 17.7% |
| Standard Deviation (Population) | 7.5% | 17.4% |
Similar Demographics by Male Unemployment
Demographics Similar to Spanish American Indians by Male Unemployment
In terms of male unemployment, the demographic groups most similar to Spanish American Indians are Immigrants from Ecuador (6.2%, a difference of 0.020%), African (6.3%, a difference of 0.45%), Immigrants from Western Africa (6.2%, a difference of 0.65%), Ecuadorian (6.2%, a difference of 0.68%), and Central American Indian (6.3%, a difference of 0.74%).
| Demographics | Rating | Rank | Male Unemployment |
| Immigrants | Liberia | 0.0 /100 | #277 | Tragic 6.1% |
| Immigrants | Fiji | 0.0 /100 | #278 | Tragic 6.1% |
| Ghanaians | 0.0 /100 | #279 | Tragic 6.1% |
| Immigrants | Ghana | 0.0 /100 | #280 | Tragic 6.2% |
| Sierra Leoneans | 0.0 /100 | #281 | Tragic 6.2% |
| Ecuadorians | 0.0 /100 | #282 | Tragic 6.2% |
| Immigrants | Western Africa | 0.0 /100 | #283 | Tragic 6.2% |
| Spanish American Indians | 0.0 /100 | #284 | Tragic 6.2% |
| Immigrants | Ecuador | 0.0 /100 | #285 | Tragic 6.2% |
| Africans | 0.0 /100 | #286 | Tragic 6.3% |
| Central American Indians | 0.0 /100 | #287 | Tragic 6.3% |
| Immigrants | Senegal | 0.0 /100 | #288 | Tragic 6.3% |
| Immigrants | Caribbean | 0.0 /100 | #289 | Tragic 6.3% |
| U.S. Virgin Islanders | 0.0 /100 | #290 | Tragic 6.4% |
| Immigrants | Azores | 0.0 /100 | #291 | Tragic 6.4% |
Demographics Similar to Immigrants from Zaire by Male Unemployment
In terms of male unemployment, the demographic groups most similar to Immigrants from Zaire are Immigrants from Philippines (5.4%, a difference of 0.020%), Nonimmigrants (5.4%, a difference of 0.070%), Immigrants from Laos (5.4%, a difference of 0.080%), Immigrants from Greece (5.4%, a difference of 0.10%), and Immigrants from Thailand (5.4%, a difference of 0.12%).
| Demographics | Rating | Rank | Male Unemployment |
| Immigrants | Israel | 25.2 /100 | #193 | Fair 5.4% |
| Spanish | 19.7 /100 | #194 | Poor 5.4% |
| Immigrants | Southern Europe | 17.7 /100 | #195 | Poor 5.4% |
| Albanians | 17.3 /100 | #196 | Poor 5.4% |
| Alsatians | 16.7 /100 | #197 | Poor 5.4% |
| Immigrants | Thailand | 14.7 /100 | #198 | Poor 5.4% |
| Immigrants | Greece | 14.5 /100 | #199 | Poor 5.4% |
| Immigrants | Zaire | 13.7 /100 | #200 | Poor 5.4% |
| Immigrants | Philippines | 13.5 /100 | #201 | Poor 5.4% |
| Immigrants | Nonimmigrants | 13.1 /100 | #202 | Poor 5.4% |
| Immigrants | Laos | 13.0 /100 | #203 | Poor 5.4% |
| Guamanians/Chamorros | 12.3 /100 | #204 | Poor 5.4% |
| Immigrants | Costa Rica | 11.4 /100 | #205 | Poor 5.5% |
| Immigrants | Ukraine | 9.9 /100 | #206 | Tragic 5.5% |
| Immigrants | Syria | 9.3 /100 | #207 | Tragic 5.5% |