Spanish American Indian vs Immigrants from Ukraine Male Unemployment
COMPARE
Spanish American Indian
Immigrants from Ukraine
Male Unemployment
Male Unemployment Comparison
Spanish American Indians
Immigrants from Ukraine
6.2%
MALE UNEMPLOYMENT
0.0/ 100
METRIC RATING
284th/ 347
METRIC RANK
5.5%
MALE UNEMPLOYMENT
9.9/ 100
METRIC RATING
206th/ 347
METRIC RANK
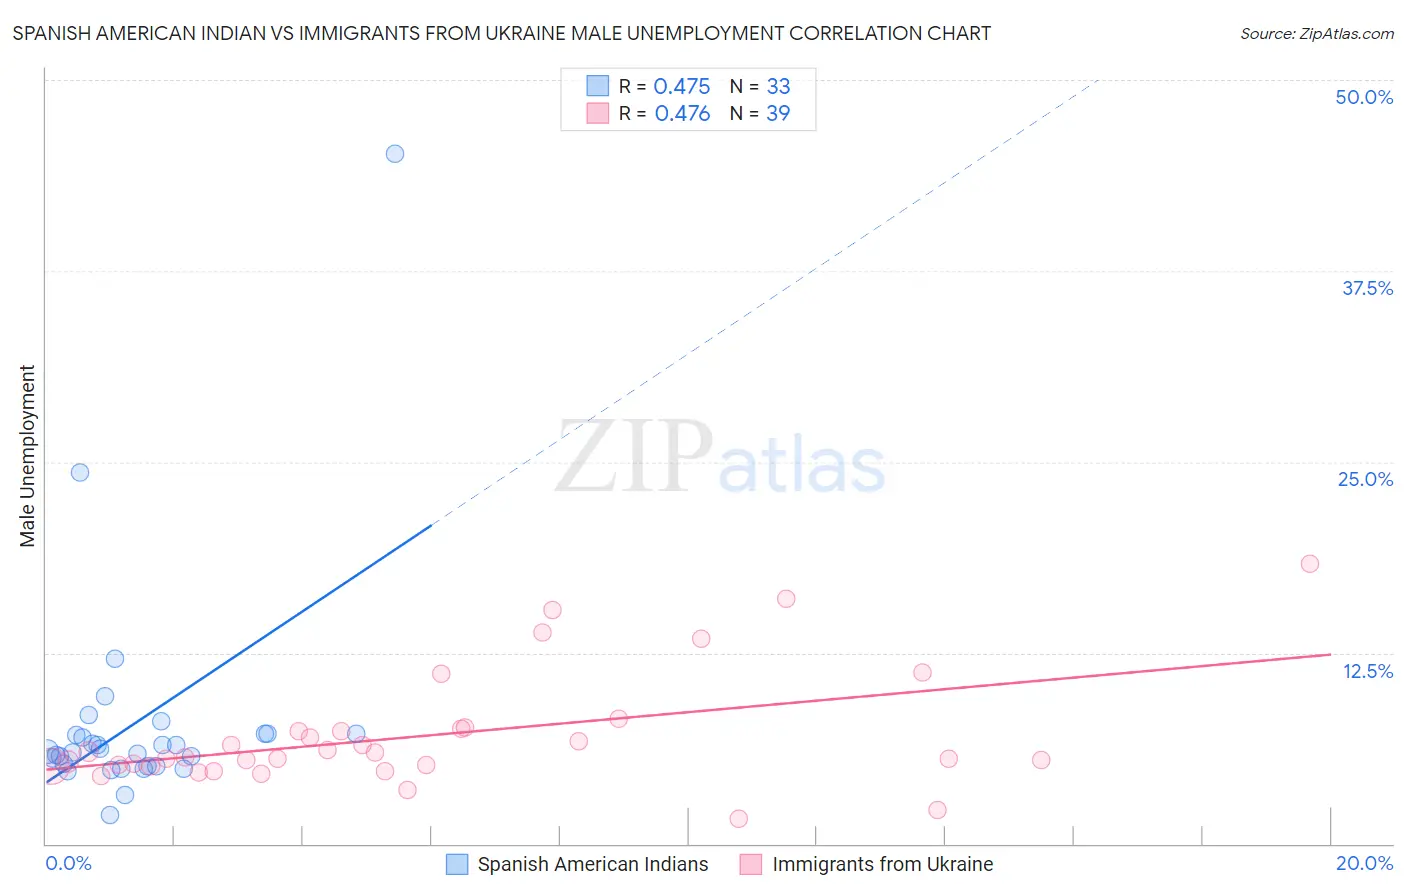
Spanish American Indian vs Immigrants from Ukraine Male Unemployment Correlation Chart
The statistical analysis conducted on geographies consisting of 73,090,721 people shows a moderate positive correlation between the proportion of Spanish American Indians and unemployment rate among males in the United States with a correlation coefficient (R) of 0.475 and weighted average of 6.2%. Similarly, the statistical analysis conducted on geographies consisting of 288,979,072 people shows a moderate positive correlation between the proportion of Immigrants from Ukraine and unemployment rate among males in the United States with a correlation coefficient (R) of 0.476 and weighted average of 5.5%, a difference of 13.9%.
Male Unemployment Correlation Summary
| Measurement | Spanish American Indian | Immigrants from Ukraine |
| Minimum | 1.9% | 1.6% |
| Maximum | 45.2% | 18.3% |
| Range | 43.3% | 16.7% |
| Mean | 7.9% | 7.1% |
| Median | 6.0% | 5.7% |
| Interquartile 25% (IQ1) | 5.1% | 5.1% |
| Interquartile 75% (IQ3) | 7.2% | 7.5% |
| Interquartile Range (IQR) | 2.1% | 2.4% |
| Standard Deviation (Sample) | 7.6% | 3.7% |
| Standard Deviation (Population) | 7.5% | 3.7% |
Similar Demographics by Male Unemployment
Demographics Similar to Spanish American Indians by Male Unemployment
In terms of male unemployment, the demographic groups most similar to Spanish American Indians are Immigrants from Ecuador (6.2%, a difference of 0.020%), African (6.3%, a difference of 0.45%), Immigrants from Western Africa (6.2%, a difference of 0.65%), Ecuadorian (6.2%, a difference of 0.68%), and Central American Indian (6.3%, a difference of 0.74%).
| Demographics | Rating | Rank | Male Unemployment |
| Immigrants | Liberia | 0.0 /100 | #277 | Tragic 6.1% |
| Immigrants | Fiji | 0.0 /100 | #278 | Tragic 6.1% |
| Ghanaians | 0.0 /100 | #279 | Tragic 6.1% |
| Immigrants | Ghana | 0.0 /100 | #280 | Tragic 6.2% |
| Sierra Leoneans | 0.0 /100 | #281 | Tragic 6.2% |
| Ecuadorians | 0.0 /100 | #282 | Tragic 6.2% |
| Immigrants | Western Africa | 0.0 /100 | #283 | Tragic 6.2% |
| Spanish American Indians | 0.0 /100 | #284 | Tragic 6.2% |
| Immigrants | Ecuador | 0.0 /100 | #285 | Tragic 6.2% |
| Africans | 0.0 /100 | #286 | Tragic 6.3% |
| Central American Indians | 0.0 /100 | #287 | Tragic 6.3% |
| Immigrants | Senegal | 0.0 /100 | #288 | Tragic 6.3% |
| Immigrants | Caribbean | 0.0 /100 | #289 | Tragic 6.3% |
| U.S. Virgin Islanders | 0.0 /100 | #290 | Tragic 6.4% |
| Immigrants | Azores | 0.0 /100 | #291 | Tragic 6.4% |
Demographics Similar to Immigrants from Ukraine by Male Unemployment
In terms of male unemployment, the demographic groups most similar to Immigrants from Ukraine are Immigrants from Syria (5.5%, a difference of 0.10%), Immigrants from Costa Rica (5.5%, a difference of 0.22%), Immigrants from Lebanon (5.5%, a difference of 0.23%), Immigrants from Middle Africa (5.5%, a difference of 0.28%), and Guamanian/Chamorro (5.4%, a difference of 0.34%).
| Demographics | Rating | Rank | Male Unemployment |
| Immigrants | Greece | 14.5 /100 | #199 | Poor 5.4% |
| Immigrants | Zaire | 13.7 /100 | #200 | Poor 5.4% |
| Immigrants | Philippines | 13.5 /100 | #201 | Poor 5.4% |
| Immigrants | Nonimmigrants | 13.1 /100 | #202 | Poor 5.4% |
| Immigrants | Laos | 13.0 /100 | #203 | Poor 5.4% |
| Guamanians/Chamorros | 12.3 /100 | #204 | Poor 5.4% |
| Immigrants | Costa Rica | 11.4 /100 | #205 | Poor 5.5% |
| Immigrants | Ukraine | 9.9 /100 | #206 | Tragic 5.5% |
| Immigrants | Syria | 9.3 /100 | #207 | Tragic 5.5% |
| Immigrants | Lebanon | 8.6 /100 | #208 | Tragic 5.5% |
| Immigrants | Middle Africa | 8.3 /100 | #209 | Tragic 5.5% |
| South American Indians | 7.6 /100 | #210 | Tragic 5.5% |
| Israelis | 7.4 /100 | #211 | Tragic 5.5% |
| Hmong | 7.0 /100 | #212 | Tragic 5.5% |
| Ugandans | 6.3 /100 | #213 | Tragic 5.5% |