Spaniard vs Immigrants from Albania Unemployment Among Ages 35 to 44 years
COMPARE
Spaniard
Immigrants from Albania
Unemployment Among Ages 35 to 44 years
Unemployment Among Ages 35 to 44 years Comparison
Spaniards
Immigrants from Albania
4.8%
UNEMPLOYMENT AMONG AGES 35 TO 44 YEARS
18.7/ 100
METRIC RATING
205th/ 347
METRIC RANK
4.8%
UNEMPLOYMENT AMONG AGES 35 TO 44 YEARS
30.5/ 100
METRIC RATING
192nd/ 347
METRIC RANK
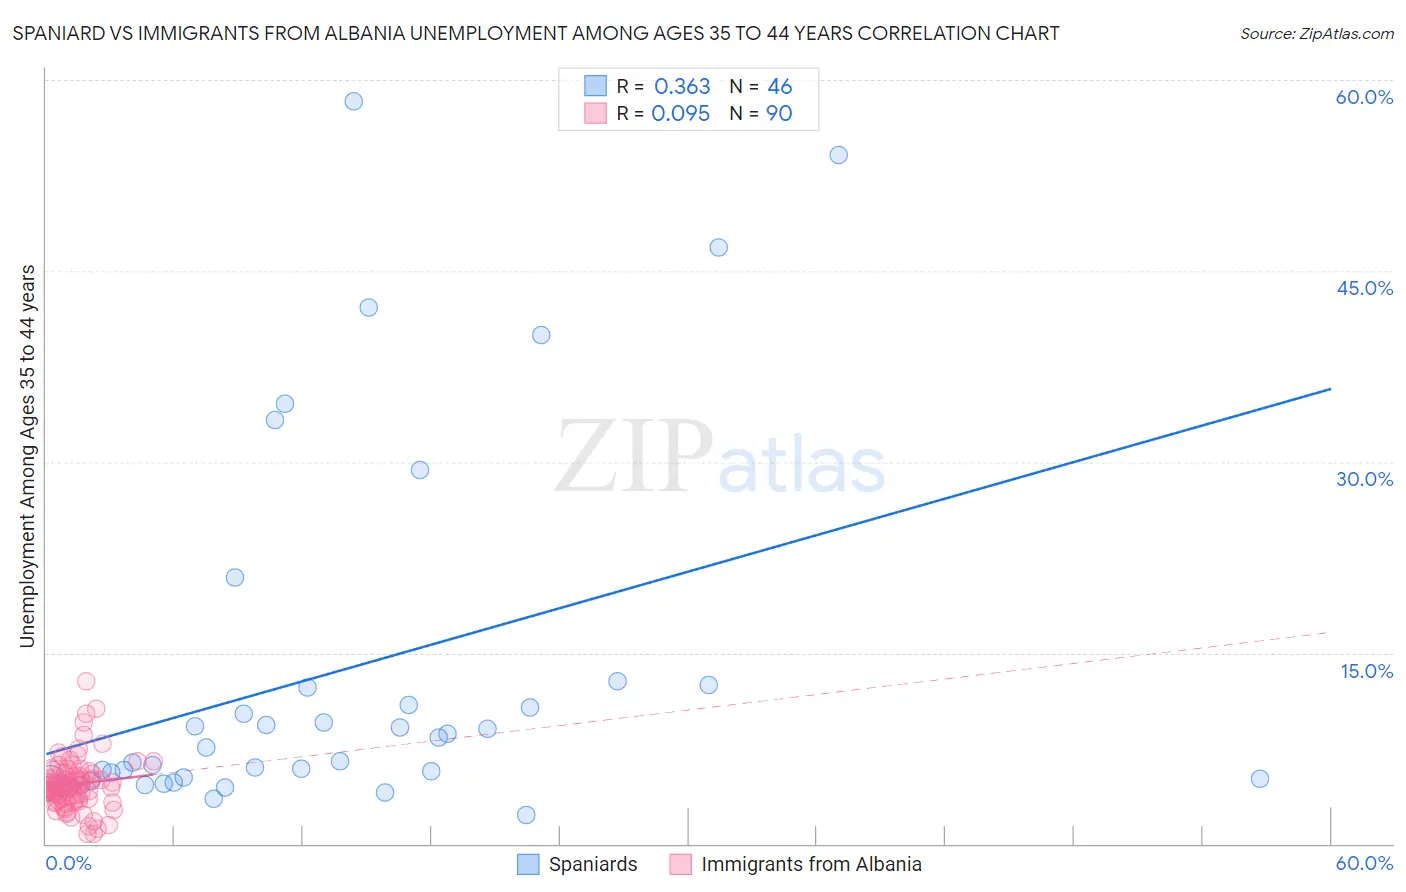
Spaniard vs Immigrants from Albania Unemployment Among Ages 35 to 44 years Correlation Chart
The statistical analysis conducted on geographies consisting of 431,052,510 people shows a mild positive correlation between the proportion of Spaniards and unemployment rate among population between the ages 35 and 44 in the United States with a correlation coefficient (R) of 0.363 and weighted average of 4.8%. Similarly, the statistical analysis conducted on geographies consisting of 118,529,524 people shows a slight positive correlation between the proportion of Immigrants from Albania and unemployment rate among population between the ages 35 and 44 in the United States with a correlation coefficient (R) of 0.095 and weighted average of 4.8%, a difference of 1.1%.
Unemployment Among Ages 35 to 44 years Correlation Summary
| Measurement | Spaniard | Immigrants from Albania |
| Minimum | 2.3% | 0.80% |
| Maximum | 58.3% | 12.8% |
| Range | 56.0% | 12.0% |
| Mean | 13.4% | 4.7% |
| Median | 7.0% | 4.5% |
| Interquartile 25% (IQ1) | 4.9% | 3.5% |
| Interquartile 75% (IQ3) | 12.2% | 5.5% |
| Interquartile Range (IQR) | 7.3% | 2.0% |
| Standard Deviation (Sample) | 14.4% | 2.0% |
| Standard Deviation (Population) | 14.2% | 2.0% |
Demographics Similar to Spaniards and Immigrants from Albania by Unemployment Among Ages 35 to 44 years
In terms of unemployment among ages 35 to 44 years, the demographic groups most similar to Spaniards are Soviet Union (4.8%, a difference of 0.040%), Immigrants from Philippines (4.8%, a difference of 0.12%), Uruguayan (4.8%, a difference of 0.14%), Immigrants from Afghanistan (4.8%, a difference of 0.17%), and Immigrants from Western Asia (4.8%, a difference of 0.25%). Similarly, the demographic groups most similar to Immigrants from Albania are Spanish (4.8%, a difference of 0.010%), Korean (4.8%, a difference of 0.20%), Bangladeshi (4.8%, a difference of 0.21%), Immigrants from South America (4.7%, a difference of 0.26%), and Immigrants from Southern Europe (4.7%, a difference of 0.27%).
| Demographics | Rating | Rank | Unemployment Among Ages 35 to 44 years |
| Immigrants | Laos | 34.5 /100 | #188 | Fair 4.7% |
| Immigrants | Congo | 33.9 /100 | #189 | Fair 4.7% |
| Immigrants | Southern Europe | 33.8 /100 | #190 | Fair 4.7% |
| Immigrants | South America | 33.8 /100 | #191 | Fair 4.7% |
| Immigrants | Albania | 30.5 /100 | #192 | Fair 4.8% |
| Spanish | 30.4 /100 | #193 | Fair 4.8% |
| Koreans | 28.1 /100 | #194 | Fair 4.8% |
| Bangladeshis | 28.0 /100 | #195 | Fair 4.8% |
| Immigrants | Syria | 23.6 /100 | #196 | Fair 4.8% |
| Immigrants | Oceania | 23.2 /100 | #197 | Fair 4.8% |
| Immigrants | Thailand | 22.9 /100 | #198 | Fair 4.8% |
| Immigrants | Middle Africa | 21.9 /100 | #199 | Fair 4.8% |
| Immigrants | Ukraine | 21.4 /100 | #200 | Fair 4.8% |
| Ugandans | 21.4 /100 | #201 | Fair 4.8% |
| Immigrants | Afghanistan | 20.2 /100 | #202 | Fair 4.8% |
| Uruguayans | 20.0 /100 | #203 | Fair 4.8% |
| Immigrants | Philippines | 19.8 /100 | #204 | Poor 4.8% |
| Spaniards | 18.7 /100 | #205 | Poor 4.8% |
| Soviet Union | 18.4 /100 | #206 | Poor 4.8% |
| Immigrants | Western Asia | 16.6 /100 | #207 | Poor 4.8% |
| French Canadians | 16.5 /100 | #208 | Poor 4.8% |