Blackfeet vs Immigrants from Ecuador Unemployment Among Ages 35 to 44 years
COMPARE
Blackfeet
Immigrants from Ecuador
Unemployment Among Ages 35 to 44 years
Unemployment Among Ages 35 to 44 years Comparison
Blackfeet
Immigrants from Ecuador
5.3%
UNEMPLOYMENT AMONG AGES 35 TO 44 YEARS
0.0/ 100
METRIC RATING
270th/ 347
METRIC RANK
5.4%
UNEMPLOYMENT AMONG AGES 35 TO 44 YEARS
0.0/ 100
METRIC RATING
283rd/ 347
METRIC RANK
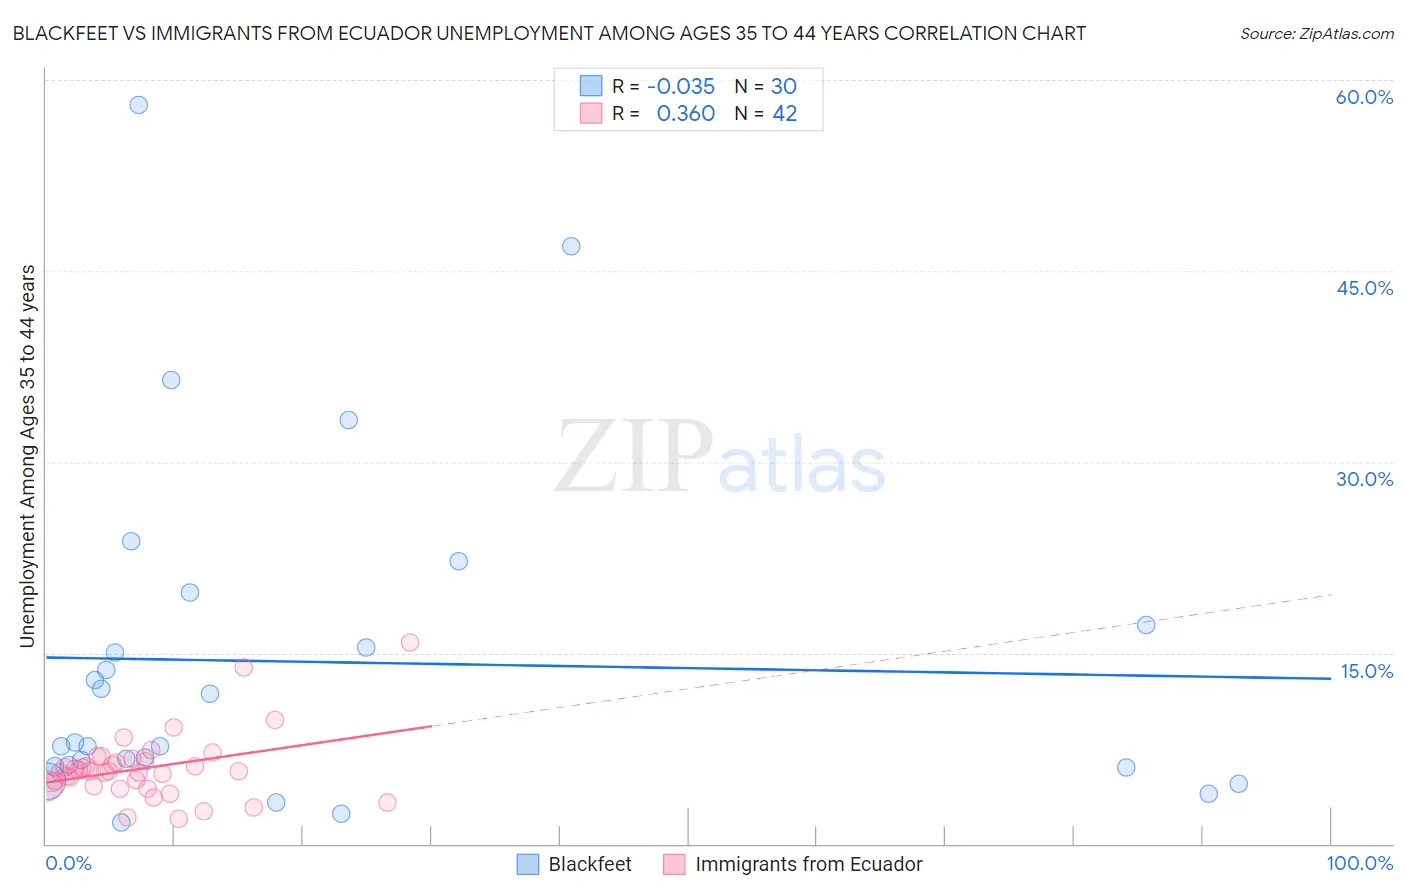
Blackfeet vs Immigrants from Ecuador Unemployment Among Ages 35 to 44 years Correlation Chart
The statistical analysis conducted on geographies consisting of 303,418,469 people shows no correlation between the proportion of Blackfeet and unemployment rate among population between the ages 35 and 44 in the United States with a correlation coefficient (R) of -0.035 and weighted average of 5.3%. Similarly, the statistical analysis conducted on geographies consisting of 267,738,021 people shows a mild positive correlation between the proportion of Immigrants from Ecuador and unemployment rate among population between the ages 35 and 44 in the United States with a correlation coefficient (R) of 0.360 and weighted average of 5.4%, a difference of 2.1%.
Unemployment Among Ages 35 to 44 years Correlation Summary
| Measurement | Blackfeet | Immigrants from Ecuador |
| Minimum | 1.7% | 2.0% |
| Maximum | 58.0% | 15.8% |
| Range | 56.3% | 13.8% |
| Mean | 14.3% | 5.9% |
| Median | 7.8% | 5.7% |
| Interquartile 25% (IQ1) | 6.0% | 4.6% |
| Interquartile 75% (IQ3) | 17.2% | 6.5% |
| Interquartile Range (IQR) | 11.2% | 1.9% |
| Standard Deviation (Sample) | 13.5% | 2.6% |
| Standard Deviation (Population) | 13.3% | 2.6% |
Demographics Similar to Blackfeet and Immigrants from Ecuador by Unemployment Among Ages 35 to 44 years
In terms of unemployment among ages 35 to 44 years, the demographic groups most similar to Blackfeet are Cajun (5.3%, a difference of 0.14%), Hawaiian (5.3%, a difference of 0.15%), Ute (5.3%, a difference of 0.17%), Senegalese (5.3%, a difference of 0.18%), and Immigrants from Western Africa (5.3%, a difference of 0.23%). Similarly, the demographic groups most similar to Immigrants from Ecuador are Haitian (5.5%, a difference of 0.54%), Immigrants from Ghana (5.4%, a difference of 0.62%), Hispanic or Latino (5.5%, a difference of 0.70%), Immigrants from Micronesia (5.5%, a difference of 0.82%), and Immigrants from Portugal (5.4%, a difference of 1.0%).
| Demographics | Rating | Rank | Unemployment Among Ages 35 to 44 years |
| Immigrants | Bangladesh | 0.1 /100 | #266 | Tragic 5.3% |
| Immigrants | Western Africa | 0.0 /100 | #267 | Tragic 5.3% |
| Hawaiians | 0.0 /100 | #268 | Tragic 5.3% |
| Cajuns | 0.0 /100 | #269 | Tragic 5.3% |
| Blackfeet | 0.0 /100 | #270 | Tragic 5.3% |
| Ute | 0.0 /100 | #271 | Tragic 5.3% |
| Senegalese | 0.0 /100 | #272 | Tragic 5.3% |
| Vietnamese | 0.0 /100 | #273 | Tragic 5.4% |
| Creek | 0.0 /100 | #274 | Tragic 5.4% |
| Immigrants | Mexico | 0.0 /100 | #275 | Tragic 5.4% |
| Native Hawaiians | 0.0 /100 | #276 | Tragic 5.4% |
| Immigrants | Caribbean | 0.0 /100 | #277 | Tragic 5.4% |
| Lumbee | 0.0 /100 | #278 | Tragic 5.4% |
| Immigrants | Senegal | 0.0 /100 | #279 | Tragic 5.4% |
| Ecuadorians | 0.0 /100 | #280 | Tragic 5.4% |
| Immigrants | Portugal | 0.0 /100 | #281 | Tragic 5.4% |
| Immigrants | Ghana | 0.0 /100 | #282 | Tragic 5.4% |
| Immigrants | Ecuador | 0.0 /100 | #283 | Tragic 5.4% |
| Haitians | 0.0 /100 | #284 | Tragic 5.5% |
| Hispanics or Latinos | 0.0 /100 | #285 | Tragic 5.5% |
| Immigrants | Micronesia | 0.0 /100 | #286 | Tragic 5.5% |