Spaniard vs Swedish Unemployment Among Ages 35 to 44 years
COMPARE
Spaniard
Swedish
Unemployment Among Ages 35 to 44 years
Unemployment Among Ages 35 to 44 years Comparison
Spaniards
Swedes
4.8%
UNEMPLOYMENT AMONG AGES 35 TO 44 YEARS
18.7/ 100
METRIC RATING
205th/ 347
METRIC RANK
4.2%
UNEMPLOYMENT AMONG AGES 35 TO 44 YEARS
99.8/ 100
METRIC RATING
17th/ 347
METRIC RANK
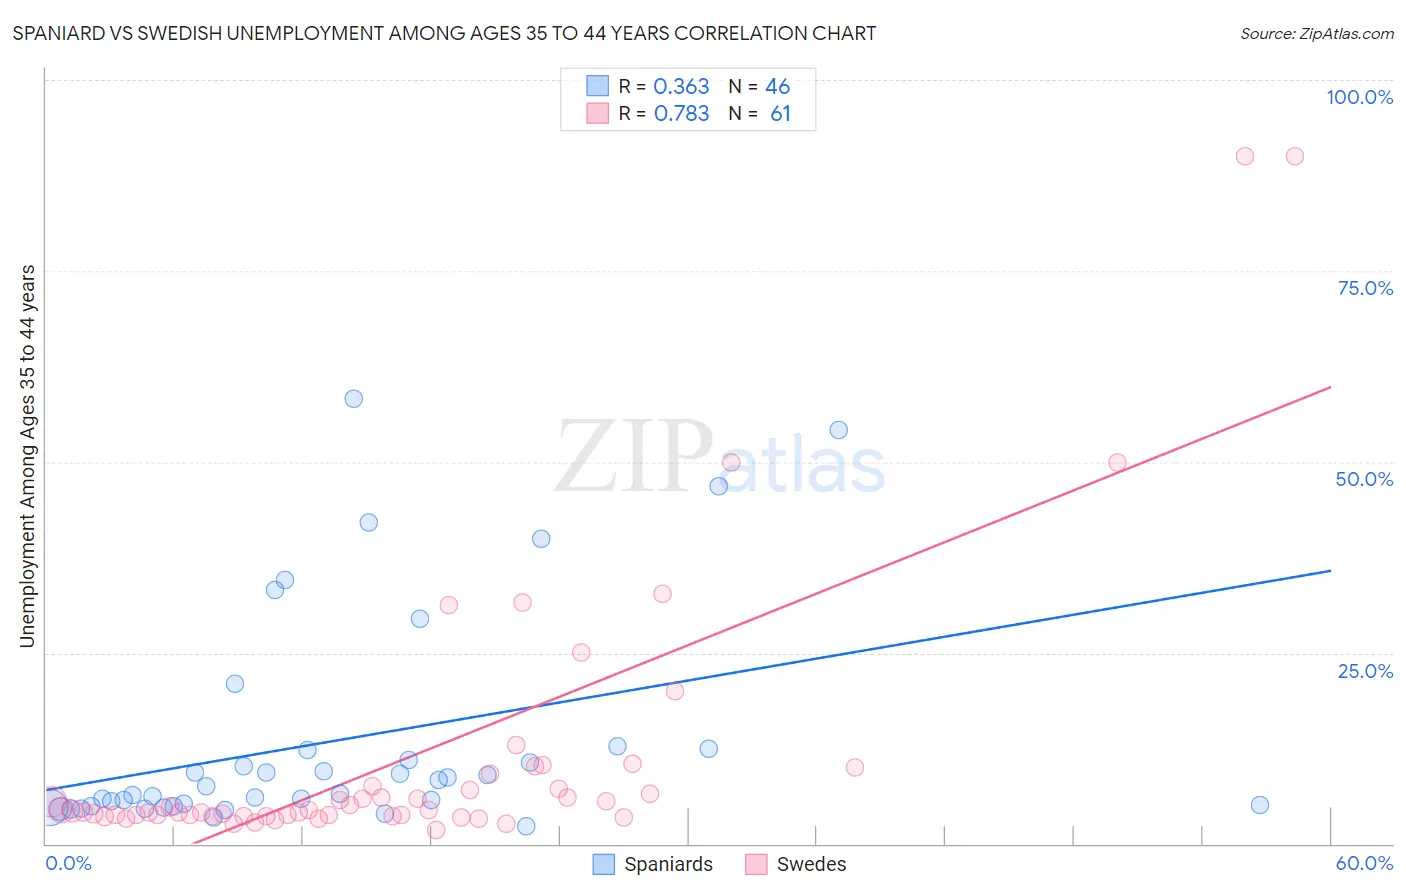
Spaniard vs Swedish Unemployment Among Ages 35 to 44 years Correlation Chart
The statistical analysis conducted on geographies consisting of 431,052,510 people shows a mild positive correlation between the proportion of Spaniards and unemployment rate among population between the ages 35 and 44 in the United States with a correlation coefficient (R) of 0.363 and weighted average of 4.8%. Similarly, the statistical analysis conducted on geographies consisting of 506,877,599 people shows a strong positive correlation between the proportion of Swedes and unemployment rate among population between the ages 35 and 44 in the United States with a correlation coefficient (R) of 0.783 and weighted average of 4.2%, a difference of 15.1%.
Unemployment Among Ages 35 to 44 years Correlation Summary
| Measurement | Spaniard | Swedish |
| Minimum | 2.3% | 1.9% |
| Maximum | 58.3% | 90.0% |
| Range | 56.0% | 88.1% |
| Mean | 13.4% | 11.2% |
| Median | 7.0% | 4.3% |
| Interquartile 25% (IQ1) | 4.9% | 3.7% |
| Interquartile 75% (IQ3) | 12.2% | 8.3% |
| Interquartile Range (IQR) | 7.3% | 4.6% |
| Standard Deviation (Sample) | 14.4% | 17.9% |
| Standard Deviation (Population) | 14.2% | 17.8% |
Similar Demographics by Unemployment Among Ages 35 to 44 years
Demographics Similar to Spaniards by Unemployment Among Ages 35 to 44 years
In terms of unemployment among ages 35 to 44 years, the demographic groups most similar to Spaniards are Soviet Union (4.8%, a difference of 0.040%), Immigrants from Philippines (4.8%, a difference of 0.12%), Uruguayan (4.8%, a difference of 0.14%), Immigrants from Afghanistan (4.8%, a difference of 0.17%), and Immigrants from Western Asia (4.8%, a difference of 0.25%).
| Demographics | Rating | Rank | Unemployment Among Ages 35 to 44 years |
| Immigrants | Thailand | 22.9 /100 | #198 | Fair 4.8% |
| Immigrants | Middle Africa | 21.9 /100 | #199 | Fair 4.8% |
| Immigrants | Ukraine | 21.4 /100 | #200 | Fair 4.8% |
| Ugandans | 21.4 /100 | #201 | Fair 4.8% |
| Immigrants | Afghanistan | 20.2 /100 | #202 | Fair 4.8% |
| Uruguayans | 20.0 /100 | #203 | Fair 4.8% |
| Immigrants | Philippines | 19.8 /100 | #204 | Poor 4.8% |
| Spaniards | 18.7 /100 | #205 | Poor 4.8% |
| Soviet Union | 18.4 /100 | #206 | Poor 4.8% |
| Immigrants | Western Asia | 16.6 /100 | #207 | Poor 4.8% |
| French Canadians | 16.5 /100 | #208 | Poor 4.8% |
| Immigrants | Uruguay | 11.5 /100 | #209 | Poor 4.9% |
| Immigrants | Cameroon | 11.4 /100 | #210 | Poor 4.9% |
| Immigrants | Nonimmigrants | 9.4 /100 | #211 | Tragic 4.9% |
| Fijians | 8.7 /100 | #212 | Tragic 4.9% |
Demographics Similar to Swedes by Unemployment Among Ages 35 to 44 years
In terms of unemployment among ages 35 to 44 years, the demographic groups most similar to Swedes are Cuban (4.2%, a difference of 0.010%), Latvian (4.2%, a difference of 0.010%), Immigrants from Nepal (4.2%, a difference of 0.28%), Immigrants from Bolivia (4.2%, a difference of 0.53%), and Tongan (4.2%, a difference of 0.78%).
| Demographics | Rating | Rank | Unemployment Among Ages 35 to 44 years |
| Immigrants | Singapore | 99.9 /100 | #10 | Exceptional 4.1% |
| Sudanese | 99.9 /100 | #11 | Exceptional 4.1% |
| Venezuelans | 99.9 /100 | #12 | Exceptional 4.1% |
| Bolivians | 99.9 /100 | #13 | Exceptional 4.1% |
| Czechs | 99.9 /100 | #14 | Exceptional 4.1% |
| Tongans | 99.8 /100 | #15 | Exceptional 4.2% |
| Cubans | 99.8 /100 | #16 | Exceptional 4.2% |
| Swedes | 99.8 /100 | #17 | Exceptional 4.2% |
| Latvians | 99.8 /100 | #18 | Exceptional 4.2% |
| Immigrants | Nepal | 99.7 /100 | #19 | Exceptional 4.2% |
| Immigrants | Bolivia | 99.7 /100 | #20 | Exceptional 4.2% |
| Paraguayans | 99.6 /100 | #21 | Exceptional 4.2% |
| Scandinavians | 99.5 /100 | #22 | Exceptional 4.2% |
| Immigrants | Kuwait | 99.5 /100 | #23 | Exceptional 4.3% |
| Tlingit-Haida | 99.5 /100 | #24 | Exceptional 4.3% |