Soviet Union vs Spanish American Indian Unemployment
COMPARE
Soviet Union
Spanish American Indian
Unemployment
Unemployment Comparison
Soviet Union
Spanish American Indians
5.4%
UNEMPLOYMENT
10.6/ 100
METRIC RATING
220th/ 347
METRIC RANK
6.2%
UNEMPLOYMENT
0.0/ 100
METRIC RATING
294th/ 347
METRIC RANK
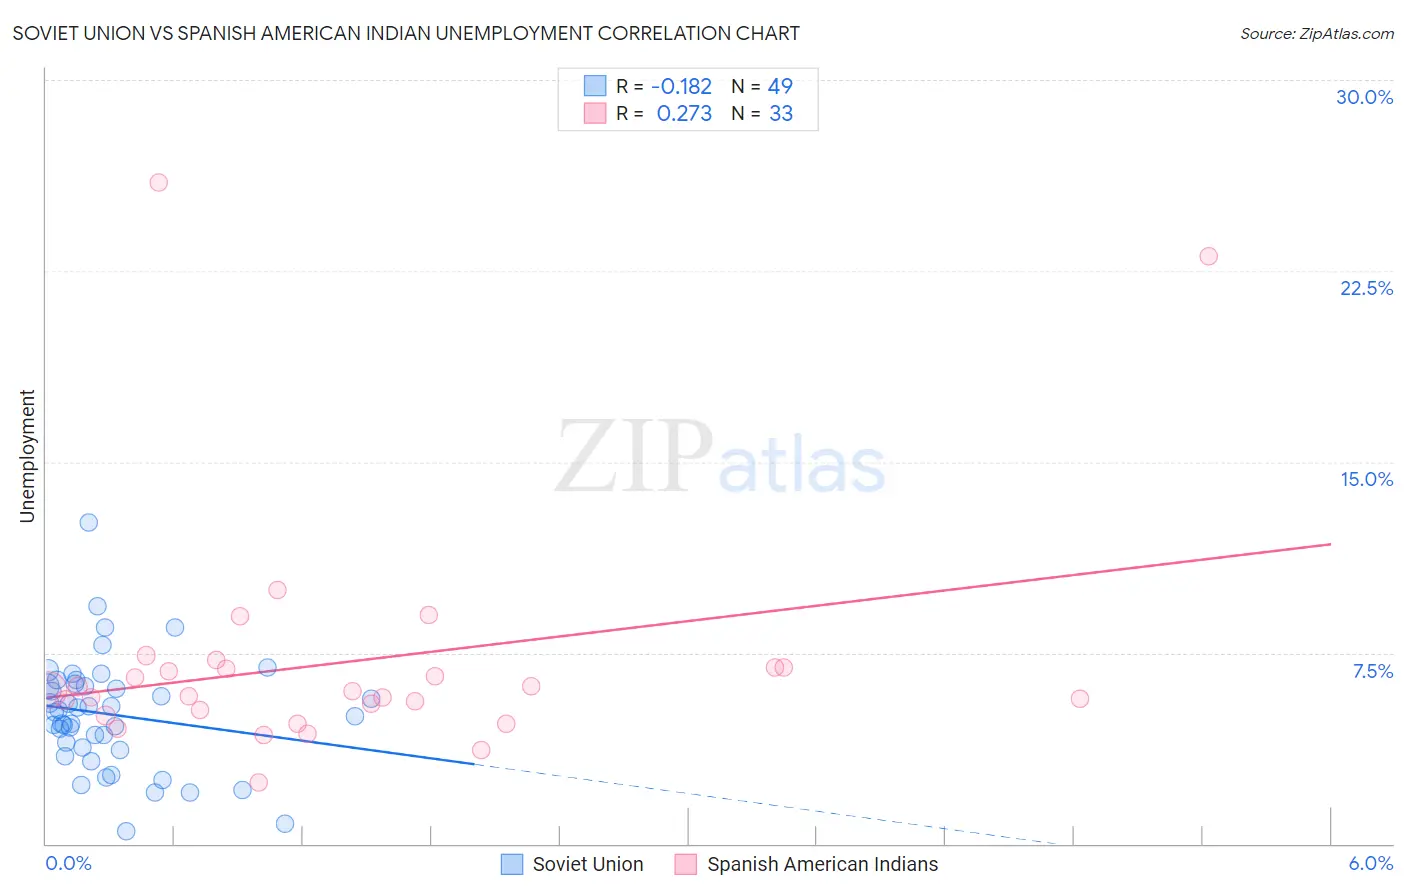
Soviet Union vs Spanish American Indian Unemployment Correlation Chart
The statistical analysis conducted on geographies consisting of 43,502,228 people shows a poor negative correlation between the proportion of Soviet Union and unemployment in the United States with a correlation coefficient (R) of -0.182 and weighted average of 5.4%. Similarly, the statistical analysis conducted on geographies consisting of 73,128,798 people shows a weak positive correlation between the proportion of Spanish American Indians and unemployment in the United States with a correlation coefficient (R) of 0.273 and weighted average of 6.2%, a difference of 15.0%.
Unemployment Correlation Summary
| Measurement | Soviet Union | Spanish American Indian |
| Minimum | 0.50% | 2.4% |
| Maximum | 12.6% | 26.0% |
| Range | 12.1% | 23.5% |
| Mean | 5.1% | 7.1% |
| Median | 5.2% | 6.0% |
| Interquartile 25% (IQ1) | 3.7% | 5.1% |
| Interquartile 75% (IQ3) | 6.2% | 6.9% |
| Interquartile Range (IQR) | 2.5% | 1.8% |
| Standard Deviation (Sample) | 2.2% | 4.7% |
| Standard Deviation (Population) | 2.2% | 4.7% |
Similar Demographics by Unemployment
Demographics Similar to Soviet Union by Unemployment
In terms of unemployment, the demographic groups most similar to Soviet Union are Immigrants from Philippines (5.4%, a difference of 0.040%), Iroquois (5.4%, a difference of 0.060%), Bangladeshi (5.4%, a difference of 0.080%), Seminole (5.4%, a difference of 0.25%), and Choctaw (5.4%, a difference of 0.30%).
| Demographics | Rating | Rank | Unemployment |
| Immigrants | Middle Africa | 15.3 /100 | #213 | Poor 5.4% |
| Immigrants | Costa Rica | 15.2 /100 | #214 | Poor 5.4% |
| Delaware | 14.7 /100 | #215 | Poor 5.4% |
| Immigrants | South America | 13.5 /100 | #216 | Poor 5.4% |
| Immigrants | Albania | 13.5 /100 | #217 | Poor 5.4% |
| Choctaw | 12.7 /100 | #218 | Poor 5.4% |
| Bangladeshis | 11.2 /100 | #219 | Poor 5.4% |
| Soviet Union | 10.6 /100 | #220 | Poor 5.4% |
| Immigrants | Philippines | 10.4 /100 | #221 | Poor 5.4% |
| Iroquois | 10.3 /100 | #222 | Poor 5.4% |
| Seminole | 9.2 /100 | #223 | Tragic 5.4% |
| Israelis | 8.8 /100 | #224 | Tragic 5.4% |
| South American Indians | 7.8 /100 | #225 | Tragic 5.5% |
| Samoans | 7.1 /100 | #226 | Tragic 5.5% |
| Immigrants | Lebanon | 7.0 /100 | #227 | Tragic 5.5% |
Demographics Similar to Spanish American Indians by Unemployment
In terms of unemployment, the demographic groups most similar to Spanish American Indians are Immigrants from Ecuador (6.2%, a difference of 0.0%), Central American Indian (6.2%, a difference of 0.090%), Haitian (6.2%, a difference of 0.11%), U.S. Virgin Islander (6.3%, a difference of 0.12%), and Ute (6.3%, a difference of 0.57%).
| Demographics | Rating | Rank | Unemployment |
| Nepalese | 0.0 /100 | #287 | Tragic 6.2% |
| Ecuadorians | 0.0 /100 | #288 | Tragic 6.2% |
| Chippewa | 0.0 /100 | #289 | Tragic 6.2% |
| Senegalese | 0.0 /100 | #290 | Tragic 6.2% |
| Haitians | 0.0 /100 | #291 | Tragic 6.2% |
| Central American Indians | 0.0 /100 | #292 | Tragic 6.2% |
| Immigrants | Ecuador | 0.0 /100 | #293 | Tragic 6.2% |
| Spanish American Indians | 0.0 /100 | #294 | Tragic 6.2% |
| U.S. Virgin Islanders | 0.0 /100 | #295 | Tragic 6.3% |
| Ute | 0.0 /100 | #296 | Tragic 6.3% |
| Jamaicans | 0.0 /100 | #297 | Tragic 6.3% |
| Immigrants | Haiti | 0.0 /100 | #298 | Tragic 6.3% |
| Immigrants | West Indies | 0.0 /100 | #299 | Tragic 6.3% |
| Immigrants | Trinidad and Tobago | 0.0 /100 | #300 | Tragic 6.3% |
| Trinidadians and Tobagonians | 0.0 /100 | #301 | Tragic 6.3% |