Soviet Union vs Serbian Unemployment
COMPARE
Soviet Union
Serbian
Unemployment
Unemployment Comparison
Soviet Union
Serbians
5.4%
UNEMPLOYMENT
10.6/ 100
METRIC RATING
220th/ 347
METRIC RANK
4.9%
UNEMPLOYMENT
98.4/ 100
METRIC RATING
70th/ 347
METRIC RANK
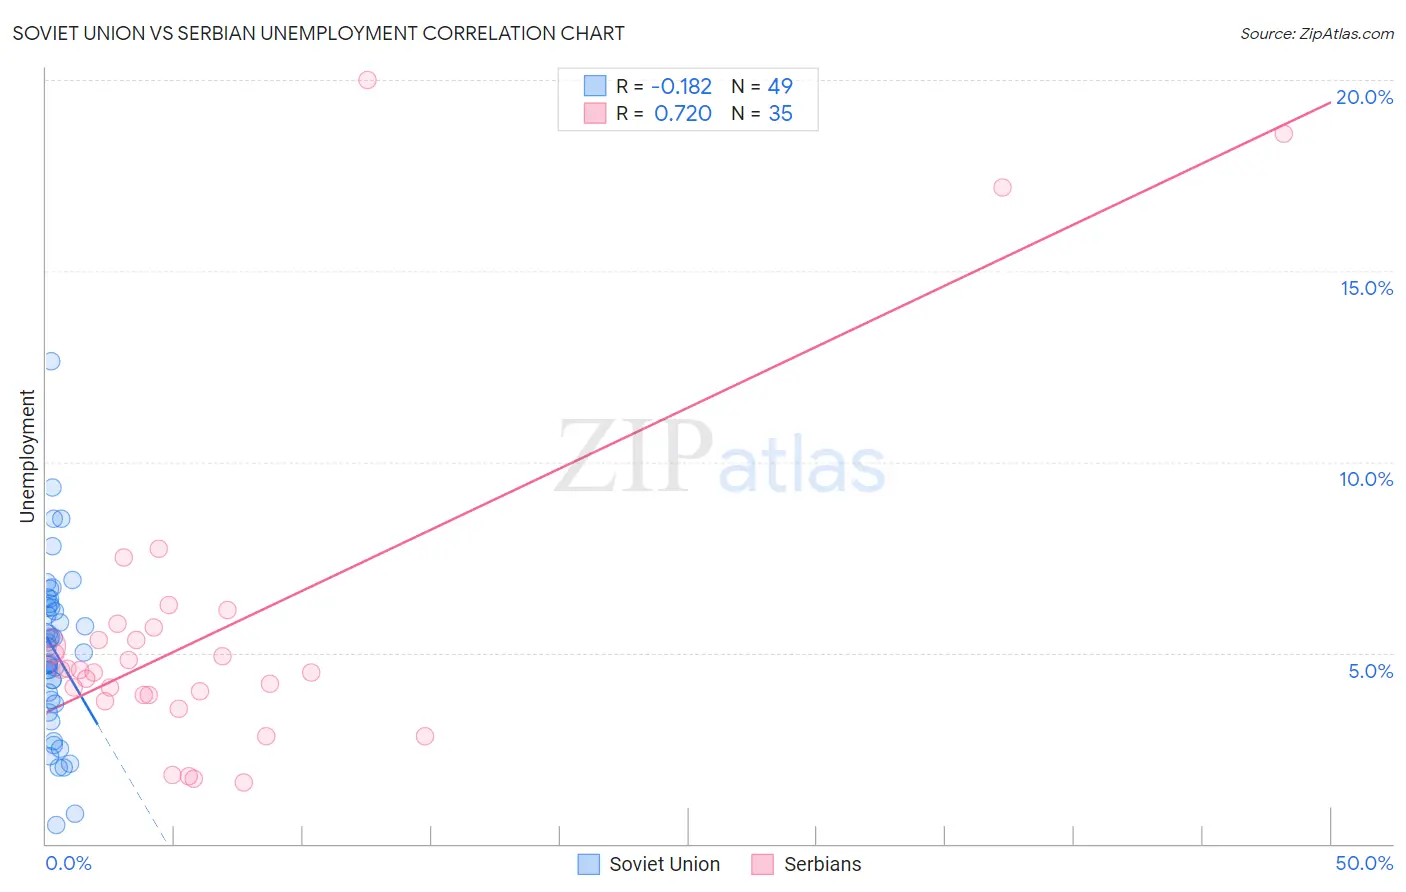
Soviet Union vs Serbian Unemployment Correlation Chart
The statistical analysis conducted on geographies consisting of 43,502,228 people shows a poor negative correlation between the proportion of Soviet Union and unemployment in the United States with a correlation coefficient (R) of -0.182 and weighted average of 5.4%. Similarly, the statistical analysis conducted on geographies consisting of 267,457,297 people shows a strong positive correlation between the proportion of Serbians and unemployment in the United States with a correlation coefficient (R) of 0.720 and weighted average of 4.9%, a difference of 10.2%.
Unemployment Correlation Summary
| Measurement | Soviet Union | Serbian |
| Minimum | 0.50% | 1.6% |
| Maximum | 12.6% | 20.0% |
| Range | 12.1% | 18.4% |
| Mean | 5.1% | 5.6% |
| Median | 5.2% | 4.6% |
| Interquartile 25% (IQ1) | 3.7% | 3.9% |
| Interquartile 75% (IQ3) | 6.2% | 5.7% |
| Interquartile Range (IQR) | 2.5% | 1.8% |
| Standard Deviation (Sample) | 2.2% | 4.3% |
| Standard Deviation (Population) | 2.2% | 4.2% |
Similar Demographics by Unemployment
Demographics Similar to Soviet Union by Unemployment
In terms of unemployment, the demographic groups most similar to Soviet Union are Immigrants from Philippines (5.4%, a difference of 0.040%), Iroquois (5.4%, a difference of 0.060%), Bangladeshi (5.4%, a difference of 0.080%), Seminole (5.4%, a difference of 0.25%), and Choctaw (5.4%, a difference of 0.30%).
| Demographics | Rating | Rank | Unemployment |
| Immigrants | Middle Africa | 15.3 /100 | #213 | Poor 5.4% |
| Immigrants | Costa Rica | 15.2 /100 | #214 | Poor 5.4% |
| Delaware | 14.7 /100 | #215 | Poor 5.4% |
| Immigrants | South America | 13.5 /100 | #216 | Poor 5.4% |
| Immigrants | Albania | 13.5 /100 | #217 | Poor 5.4% |
| Choctaw | 12.7 /100 | #218 | Poor 5.4% |
| Bangladeshis | 11.2 /100 | #219 | Poor 5.4% |
| Soviet Union | 10.6 /100 | #220 | Poor 5.4% |
| Immigrants | Philippines | 10.4 /100 | #221 | Poor 5.4% |
| Iroquois | 10.3 /100 | #222 | Poor 5.4% |
| Seminole | 9.2 /100 | #223 | Tragic 5.4% |
| Israelis | 8.8 /100 | #224 | Tragic 5.4% |
| South American Indians | 7.8 /100 | #225 | Tragic 5.5% |
| Samoans | 7.1 /100 | #226 | Tragic 5.5% |
| Immigrants | Lebanon | 7.0 /100 | #227 | Tragic 5.5% |
Demographics Similar to Serbians by Unemployment
In terms of unemployment, the demographic groups most similar to Serbians are Immigrants from Japan (4.9%, a difference of 0.050%), Burmese (4.9%, a difference of 0.080%), Paraguayan (4.9%, a difference of 0.12%), Immigrants from North America (4.9%, a difference of 0.15%), and Immigrants from Northern Europe (4.9%, a difference of 0.21%).
| Demographics | Rating | Rank | Unemployment |
| Immigrants | Bulgaria | 98.9 /100 | #63 | Exceptional 4.9% |
| Italians | 98.9 /100 | #64 | Exceptional 4.9% |
| Immigrants | Canada | 98.8 /100 | #65 | Exceptional 4.9% |
| Slovaks | 98.7 /100 | #66 | Exceptional 4.9% |
| New Zealanders | 98.6 /100 | #67 | Exceptional 4.9% |
| Slavs | 98.6 /100 | #68 | Exceptional 4.9% |
| Immigrants | North America | 98.5 /100 | #69 | Exceptional 4.9% |
| Serbians | 98.4 /100 | #70 | Exceptional 4.9% |
| Immigrants | Japan | 98.3 /100 | #71 | Exceptional 4.9% |
| Burmese | 98.3 /100 | #72 | Exceptional 4.9% |
| Paraguayans | 98.3 /100 | #73 | Exceptional 4.9% |
| Immigrants | Northern Europe | 98.2 /100 | #74 | Exceptional 4.9% |
| Turks | 98.0 /100 | #75 | Exceptional 4.9% |
| German Russians | 98.0 /100 | #76 | Exceptional 4.9% |
| Cypriots | 97.9 /100 | #77 | Exceptional 4.9% |