Guyanese vs Polish Unemployment
COMPARE
Guyanese
Polish
Unemployment
Unemployment Comparison
Guyanese
Poles
6.9%
UNEMPLOYMENT
0.0/ 100
METRIC RATING
322nd/ 347
METRIC RANK
4.7%
UNEMPLOYMENT
99.8/ 100
METRIC RATING
29th/ 347
METRIC RANK
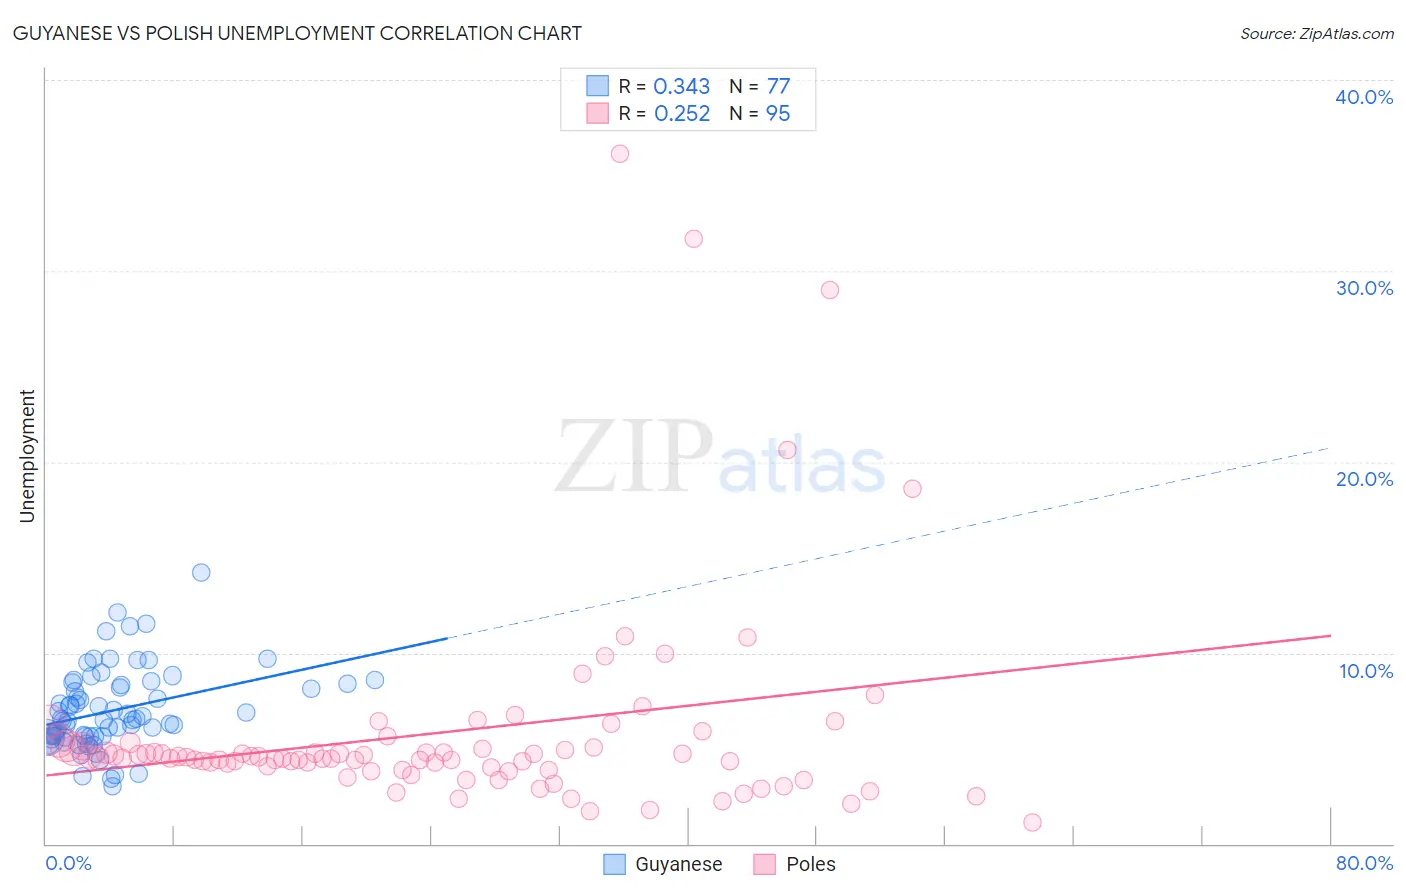
Guyanese vs Polish Unemployment Correlation Chart
The statistical analysis conducted on geographies consisting of 176,860,990 people shows a mild positive correlation between the proportion of Guyanese and unemployment in the United States with a correlation coefficient (R) of 0.343 and weighted average of 6.9%. Similarly, the statistical analysis conducted on geographies consisting of 557,090,134 people shows a weak positive correlation between the proportion of Poles and unemployment in the United States with a correlation coefficient (R) of 0.252 and weighted average of 4.7%, a difference of 45.3%.
Unemployment Correlation Summary
| Measurement | Guyanese | Polish |
| Minimum | 3.0% | 1.1% |
| Maximum | 14.2% | 36.2% |
| Range | 11.2% | 35.1% |
| Mean | 7.0% | 5.8% |
| Median | 6.5% | 4.5% |
| Interquartile 25% (IQ1) | 5.6% | 3.9% |
| Interquartile 75% (IQ3) | 8.3% | 5.1% |
| Interquartile Range (IQR) | 2.7% | 1.2% |
| Standard Deviation (Sample) | 2.1% | 5.6% |
| Standard Deviation (Population) | 2.1% | 5.5% |
Similar Demographics by Unemployment
Demographics Similar to Guyanese by Unemployment
In terms of unemployment, the demographic groups most similar to Guyanese are Immigrants from Guyana (6.9%, a difference of 0.040%), Immigrants from St. Vincent and the Grenadines (6.9%, a difference of 0.050%), Immigrants from Grenada (6.9%, a difference of 0.32%), British West Indian (6.8%, a difference of 0.85%), and Immigrants from Cabo Verde (6.8%, a difference of 1.1%).
| Demographics | Rating | Rank | Unemployment |
| Houma | 0.0 /100 | #315 | Tragic 6.7% |
| Immigrants | Dominica | 0.0 /100 | #316 | Tragic 6.7% |
| Shoshone | 0.0 /100 | #317 | Tragic 6.8% |
| Immigrants | Cabo Verde | 0.0 /100 | #318 | Tragic 6.8% |
| British West Indians | 0.0 /100 | #319 | Tragic 6.8% |
| Immigrants | St. Vincent and the Grenadines | 0.0 /100 | #320 | Tragic 6.9% |
| Immigrants | Guyana | 0.0 /100 | #321 | Tragic 6.9% |
| Guyanese | 0.0 /100 | #322 | Tragic 6.9% |
| Immigrants | Grenada | 0.0 /100 | #323 | Tragic 6.9% |
| Immigrants | Armenia | 0.0 /100 | #324 | Tragic 7.0% |
| Natives/Alaskans | 0.0 /100 | #325 | Tragic 7.0% |
| Paiute | 0.0 /100 | #326 | Tragic 7.1% |
| Pueblo | 0.0 /100 | #327 | Tragic 7.2% |
| Tsimshian | 0.0 /100 | #328 | Tragic 7.2% |
| Alaska Natives | 0.0 /100 | #329 | Tragic 7.2% |
Demographics Similar to Poles by Unemployment
In terms of unemployment, the demographic groups most similar to Poles are Cuban (4.7%, a difference of 0.12%), Irish (4.8%, a difference of 0.24%), Croatian (4.8%, a difference of 0.26%), Zimbabwean (4.8%, a difference of 0.36%), and Sudanese (4.8%, a difference of 0.37%).
| Demographics | Rating | Rank | Unemployment |
| Thais | 99.9 /100 | #22 | Exceptional 4.7% |
| British | 99.9 /100 | #23 | Exceptional 4.7% |
| Venezuelans | 99.9 /100 | #24 | Exceptional 4.7% |
| Latvians | 99.9 /100 | #25 | Exceptional 4.7% |
| Bulgarians | 99.9 /100 | #26 | Exceptional 4.7% |
| Finns | 99.9 /100 | #27 | Exceptional 4.7% |
| Cubans | 99.8 /100 | #28 | Exceptional 4.7% |
| Poles | 99.8 /100 | #29 | Exceptional 4.7% |
| Irish | 99.8 /100 | #30 | Exceptional 4.8% |
| Croatians | 99.8 /100 | #31 | Exceptional 4.8% |
| Zimbabweans | 99.8 /100 | #32 | Exceptional 4.8% |
| Sudanese | 99.8 /100 | #33 | Exceptional 4.8% |
| Immigrants | Bolivia | 99.8 /100 | #34 | Exceptional 4.8% |
| Scotch-Irish | 99.8 /100 | #35 | Exceptional 4.8% |
| Tongans | 99.7 /100 | #36 | Exceptional 4.8% |